


Paramount Deep Dive Part 1
Analyst: Joshua

Time to read: 50 min
First, I’d like to welcome new readers to The Retail Deep Dive. So glad to have you join us! Our mission is to analyse companies with exciting prospects and unpack them logically for our readers.
This month’s deep dive is on Paramount (PARA), another media behemoth, and an upcoming streaming player. The man himself, Warren Buffet, owns a 10% stake in PARA. But let’s see discover PARA for ourselves!
We decided to split our research into 2 separate articles to break it down nicely for you. The first article will be an analysis of PARA, while the second article will evaluate PARA’s financials. This is the first article.
Breakdown
History, Market perceptions, Stock price action
Business model and revenue breakdown
Analysis of PARA’s content library
Analysis of PARA’s declining cable business
Analysis of management’s strategy
Analysis of PARA’s debt
Analysis of PARA’s dividends
Conclusion

History
Paramount, or PARA for short, was formed from the merger of Viacom and CBS in 2019. Today, PARA owns more than a century of IP, with the #1 broadcast network in the U.S, the fastest-growing premium streaming service in Paramount+, and with the leading free ad-supported streaming TV service in Pluto TV. It is also the owner of many famous franchises like the Mission Impossible franchise and the recent box office hit Top Gun: Maverick. Now, allow me to give you a brief summary of the market perceptions of PARA.
Market Perceptions
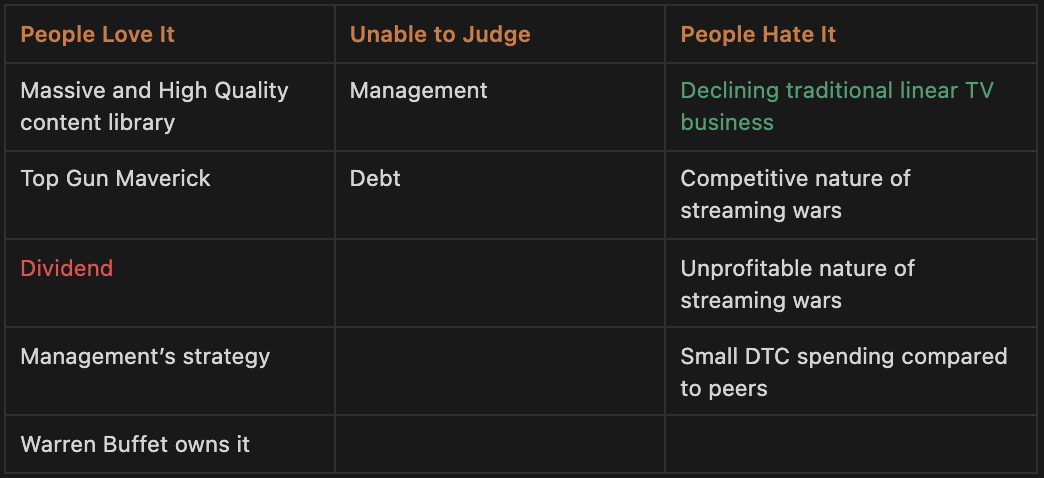
Note: These market perceptions are based upon my perceptions of what other researchers focus on when they write about PARA.
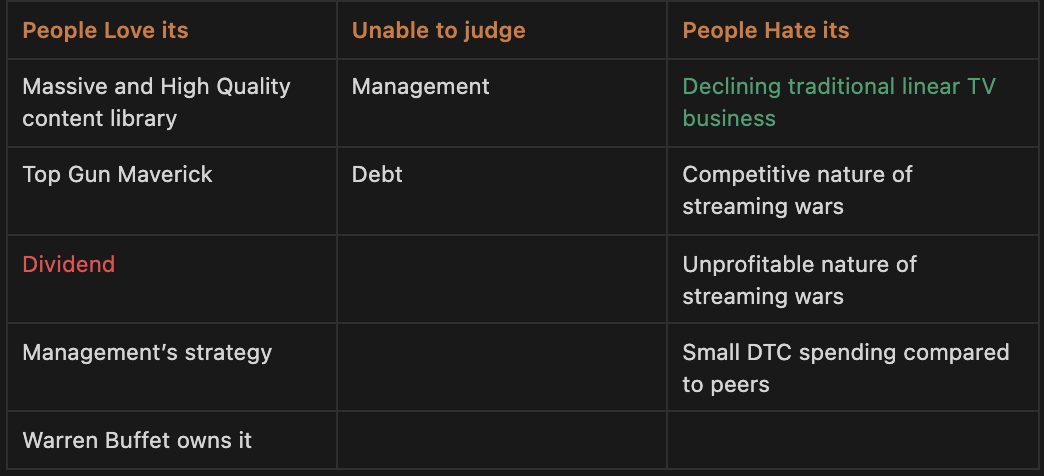
Based on my research, the number of “Hate it” and “Love it” factors are roughly balanced. In this analysis, I aim to analyze both the bull and bear views of PARA and come to my own conclusion on whether they are sound or not.
Stock Price Action

Updated 18 October
PARA’s stock price currently trades at $18.77, down 81% from its all-time highs in March 2021. Some reasons for this massive decline include :
Reason 1: Netflix losing of 200,000 subscribers in Q1Y22
Reason 2: Strong competition in the streaming space
Reason 3: Lousy macroeconomic outlook
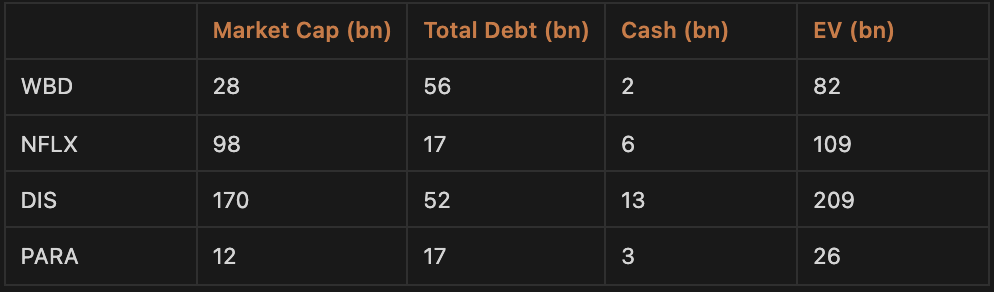
Market Cap & EV
Updated 18 October
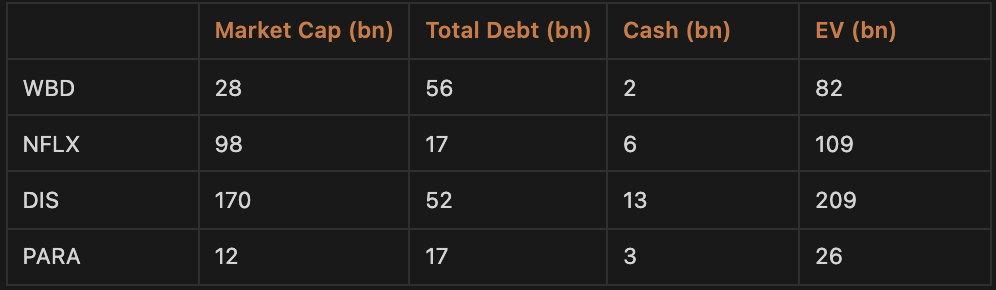
Currently, PARA has an enterprise value of $26 billion, the lowest amongst its peers.
Business Model
As a legacy media conglomerate, PARA has a diverse business model. It produces shows and distributes them through many channels. In fact, it has the exact same business model as WBD.
Revenue Breakdown
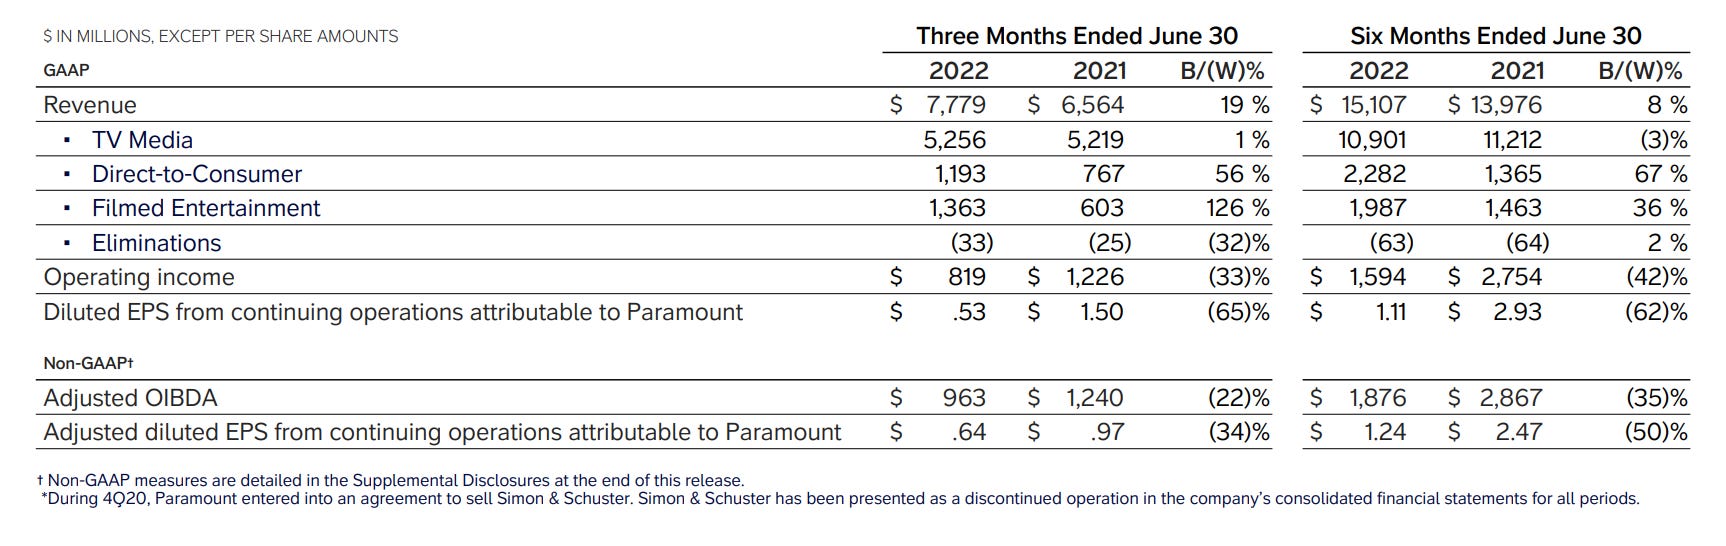
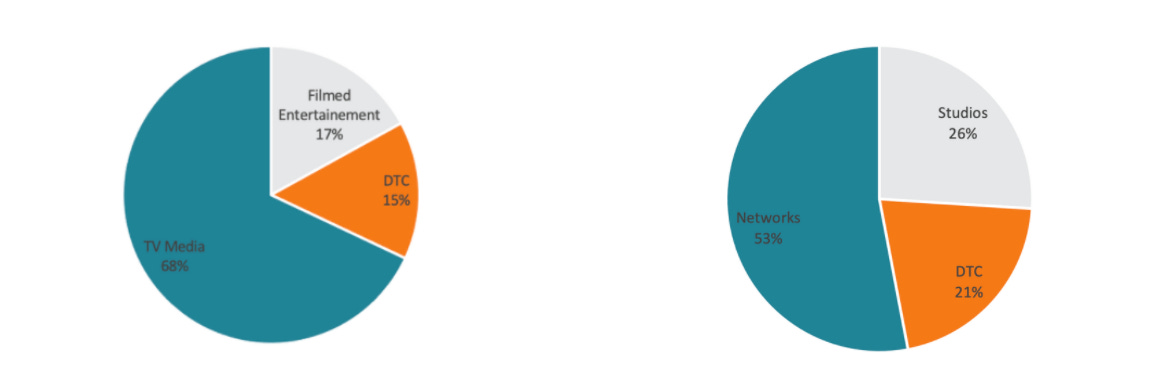
PARA categorizes its revenues into 3 streams: TV Media, Filmed Entertainment, and DTC. For Q2 2022, its breakdown is as follows:
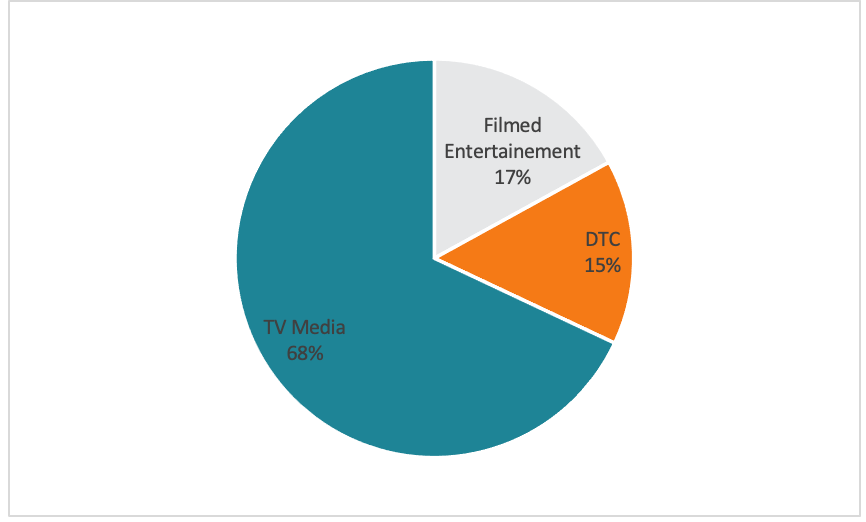
The way that PARA breaks down its business segments is identical to WBD. If we compare them in the figure below, we can see that legacy TV Media makes up a greater proportion of PARA’s total revenue compared to WBD’s. PARA’s revenue breakdown is on the left, while WBD’s is on the right.
1. TV Media
PARA’s TV Media segment consists of revenues earned from shows it produces for its traditional cable TV networks. As seen above, TV Media is currently PARA’s largest revenue contributor. Albeit a profitable segment with 26% OIBDA margins, we have to keep in mind that it’s a declining business as people cut the cord in favour of streaming. PARA has 19 cable networks. Some of PARA’s more notable TV networks include:
CBS
Paramount (cable network)
Showtime
Nickelodeon
MTV
Comedy Central
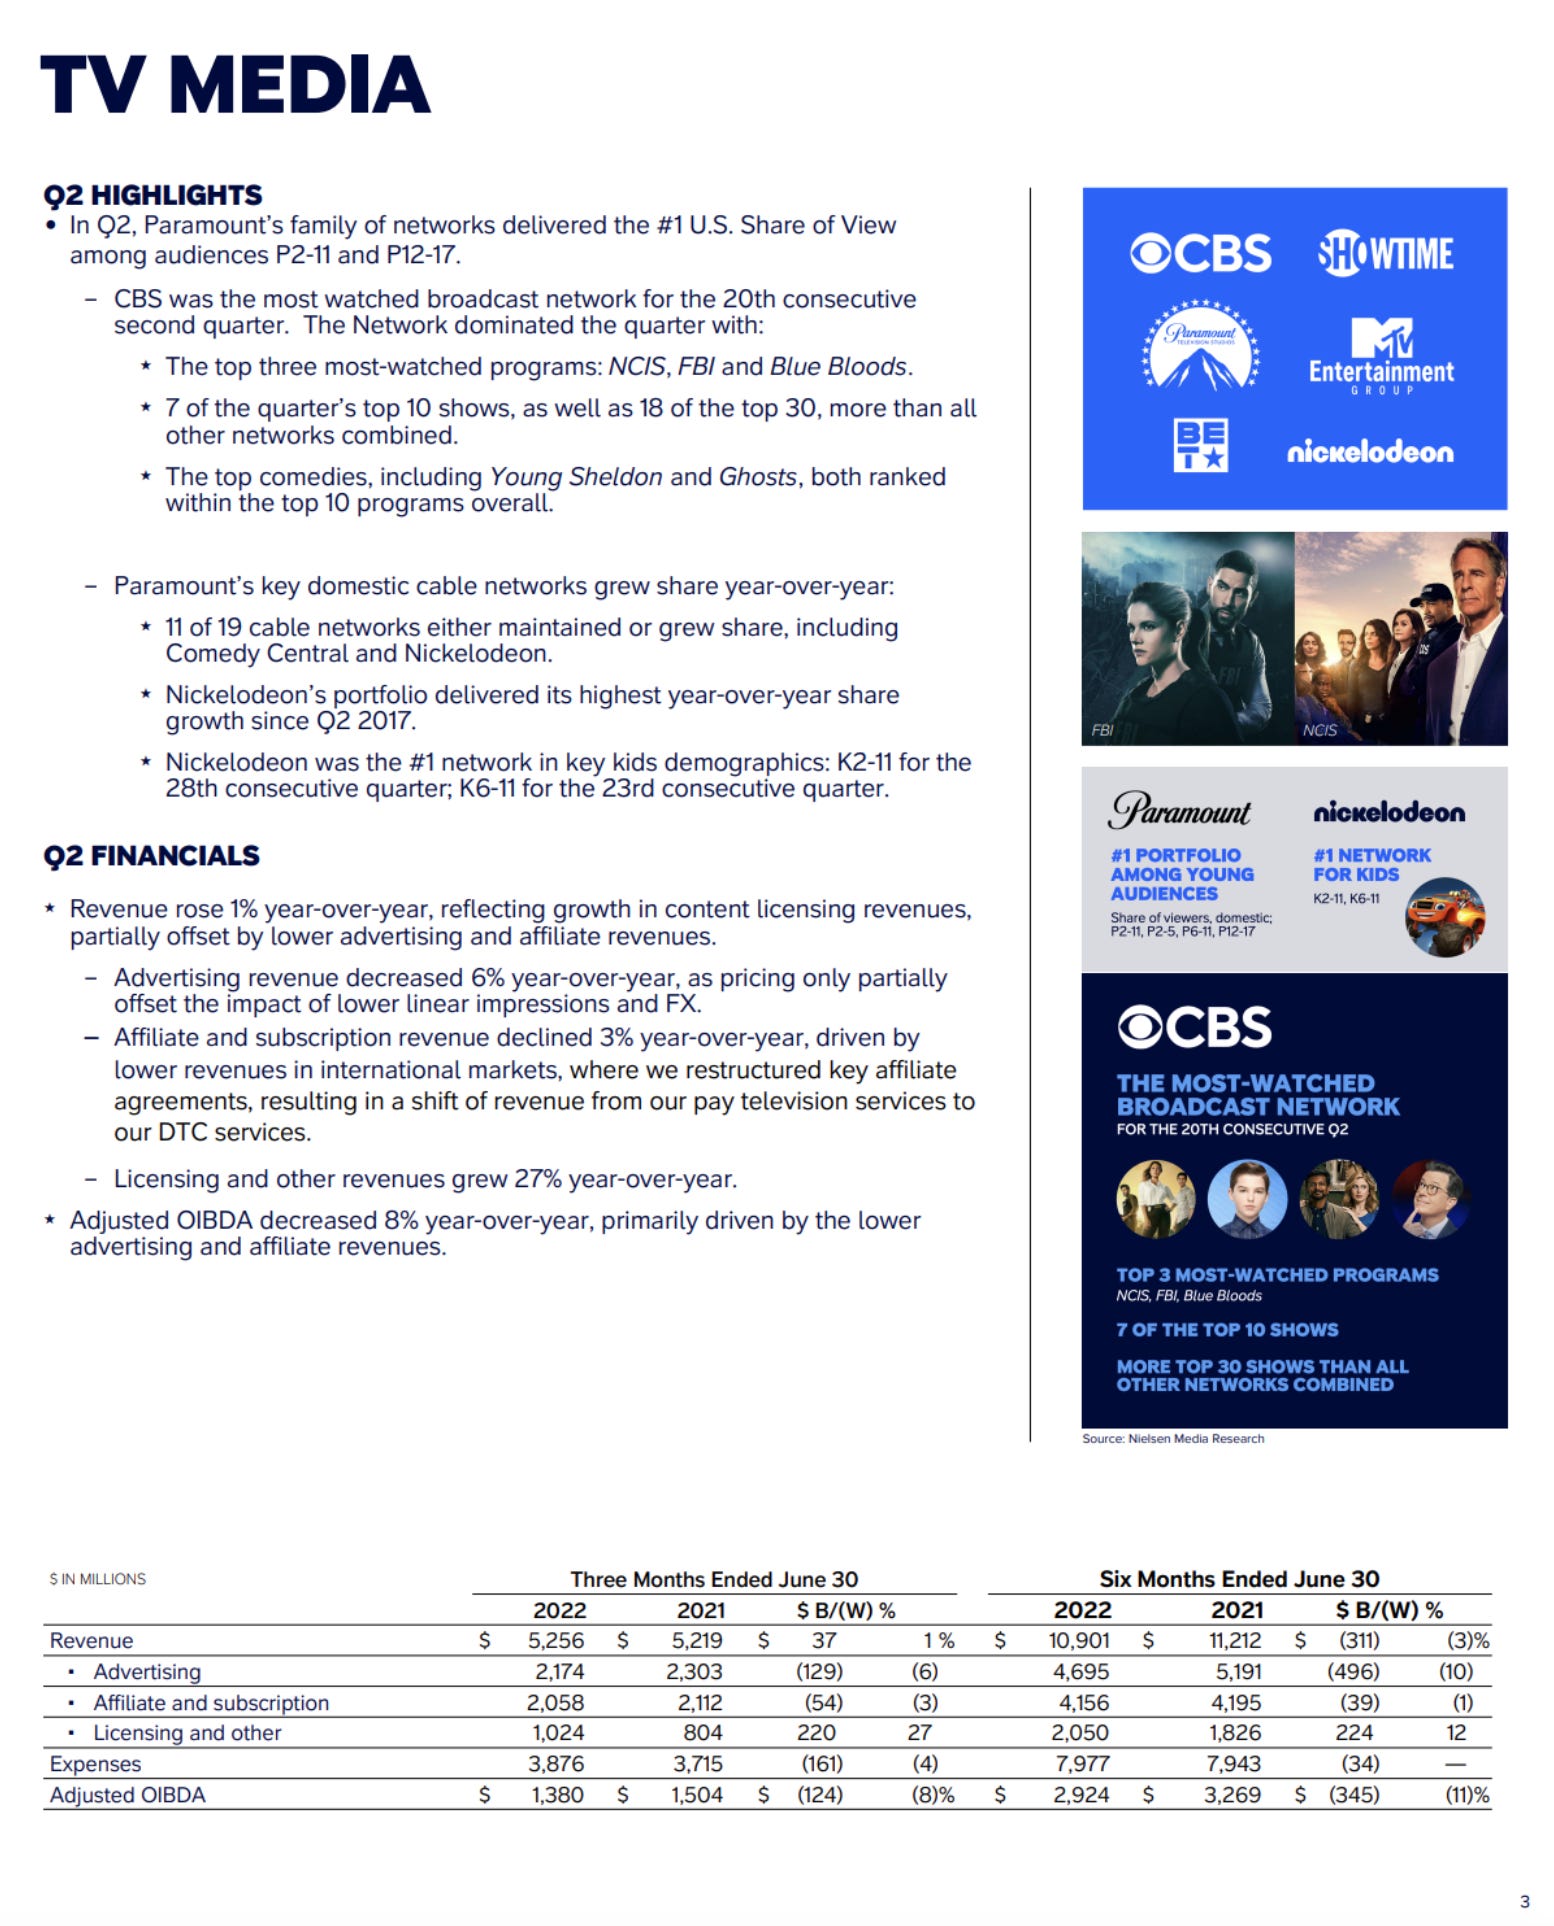
Source: 2022 Q2 Earnings Presentation
TV Market Share
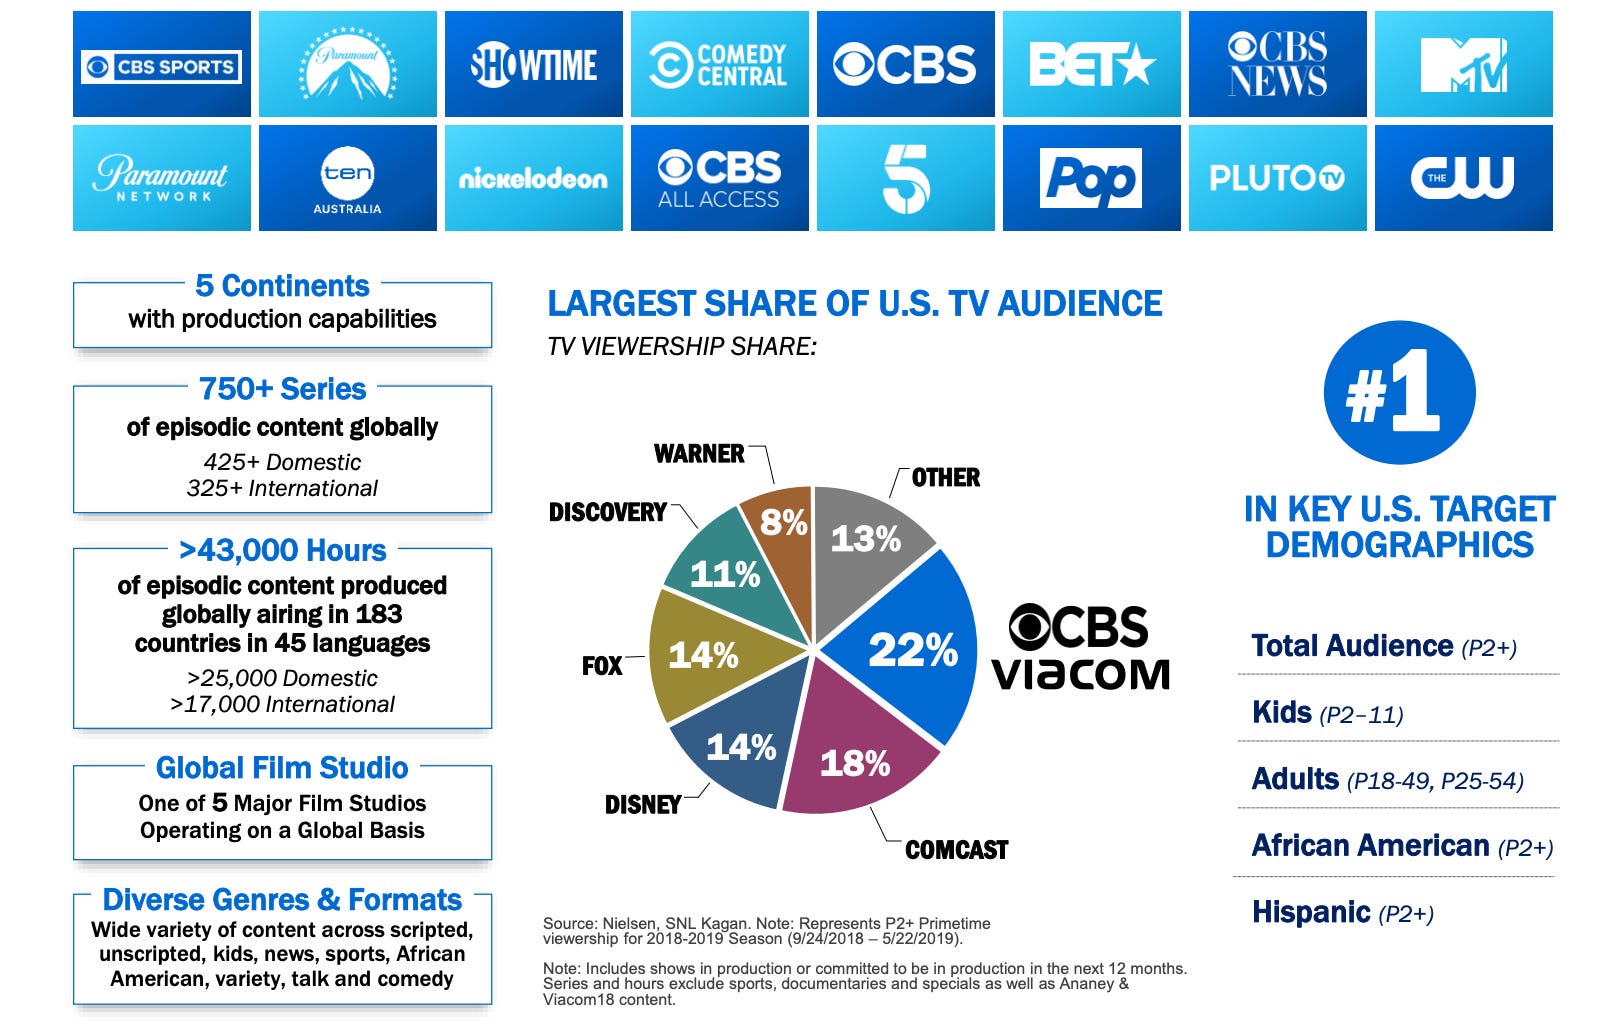
Source: Viacom VBS Merger presentation
I could not find any recent statistics on the current cable market share breakdown so I shall use data from Viacom and CBS merger presentations and deduce my conclusions from there. In 2019, PARA had the largest US TV market share at 22%. Since then, we know that Discovery and Warner merged to form WBD and Disney acquired most of Fox's assets. My estimation would put WBD having a market share of 19% and DIS having a market share of 21%. This means that:
PARA (22% market share)
DIS (21% market share)
WBD (19% market share)
COMCAST (18% market share)
While it does seem that PARA has the largest TV market share, the trailing 3 players have almost caught up. Nothing really special about PARA here.
2. Filmed Entertainment
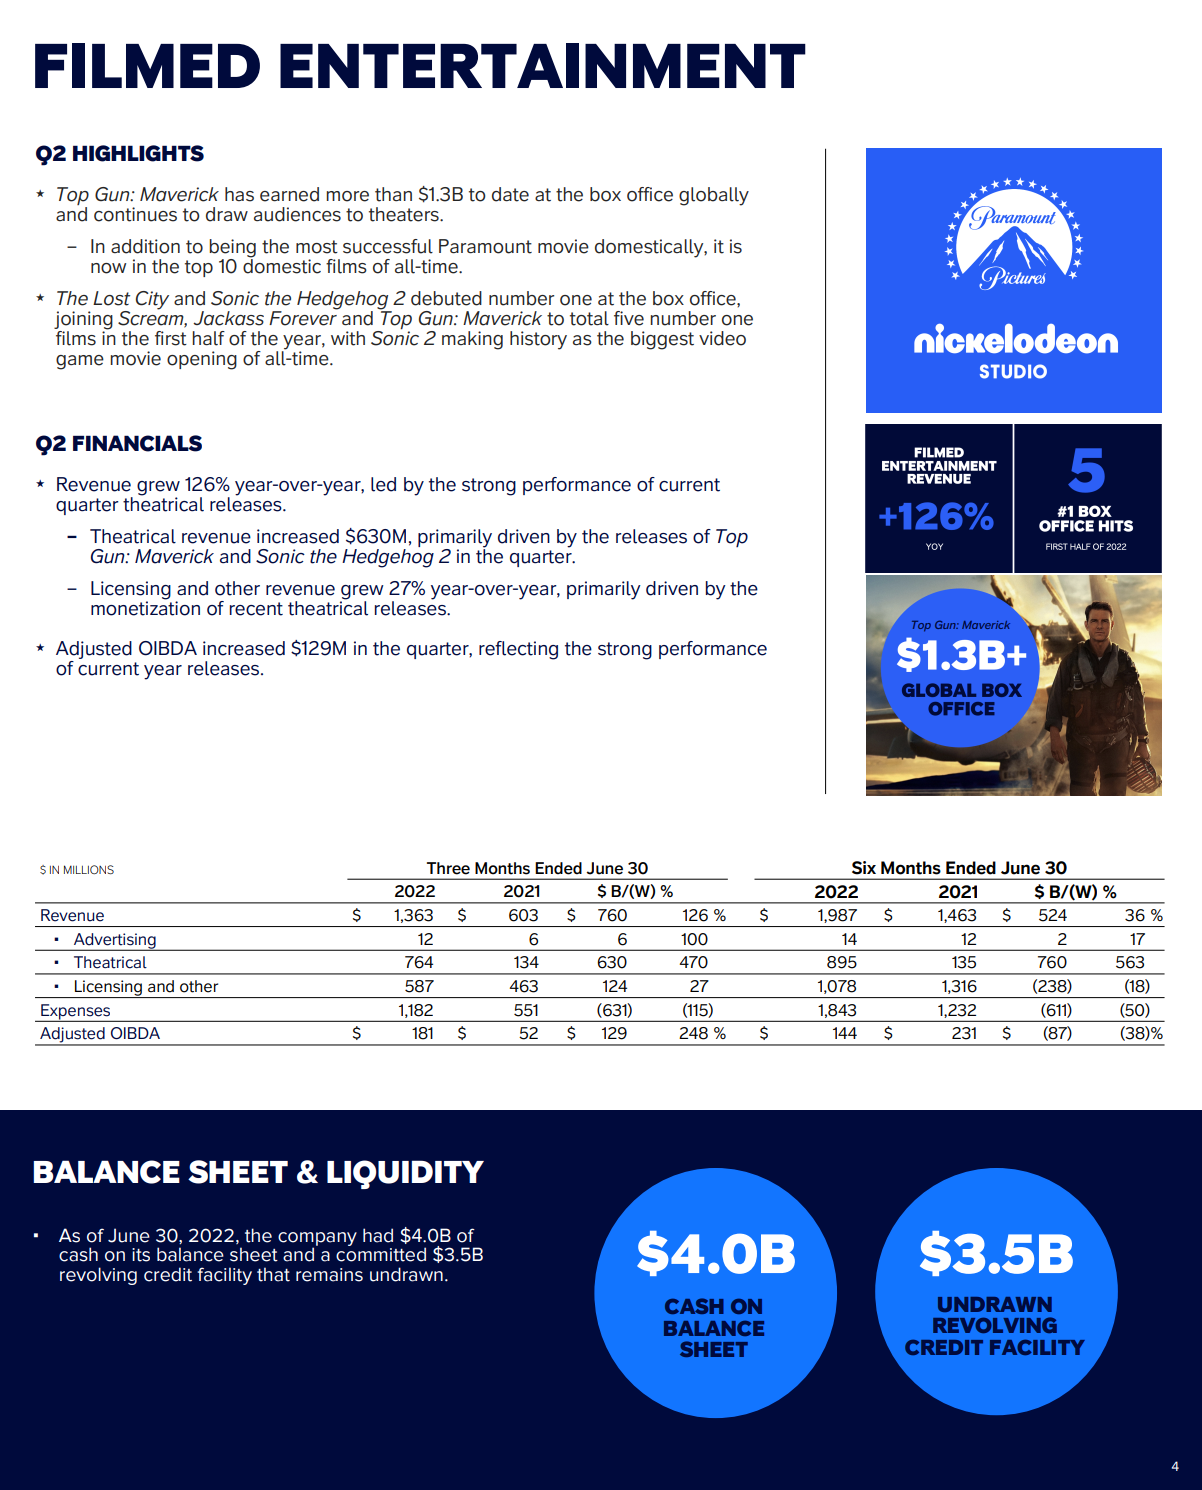
Source: 2022 Q2 Earnings Presentation
PARA’s Filmed Entertainment segment consists of revenues earned from theatrical releases and licencing. As seen above, Filmed Entertainment is currently PARA’s 2nd largest revenue contributor. Like Networks, it is currently a profitable segment with 13% OIBDA margins.
3. DTC
PARA’s Direct-To-Consumer segment consists of revenues earned from its various streaming platforms. Below is a collection of all of PARA’s streaming platforms.
1. Paramount+
Paramount+ is PARA’s flagship streaming platform. From here onwards, I will refer to it as PARA+. PARA+ contains PARA’s newest movie and TV releases.
Price: Paramount+ is available in two tiers: the ad-supported Essential Plan ($4.99 monthly), and the ad-free Premium Plan ($9.99 monthly).
Content: Content on Paramount+ includes original series like “1883,” “Halo,” “Star Trek: Discovery” and “Secret Headquarters” with upcoming originals this fall slated to include “Tulsa King,” “On the Come Up,” “Criminal Minds,” “Wolf Pack,” “1923” and the return of “The Good Fight” and “Seal Team.”
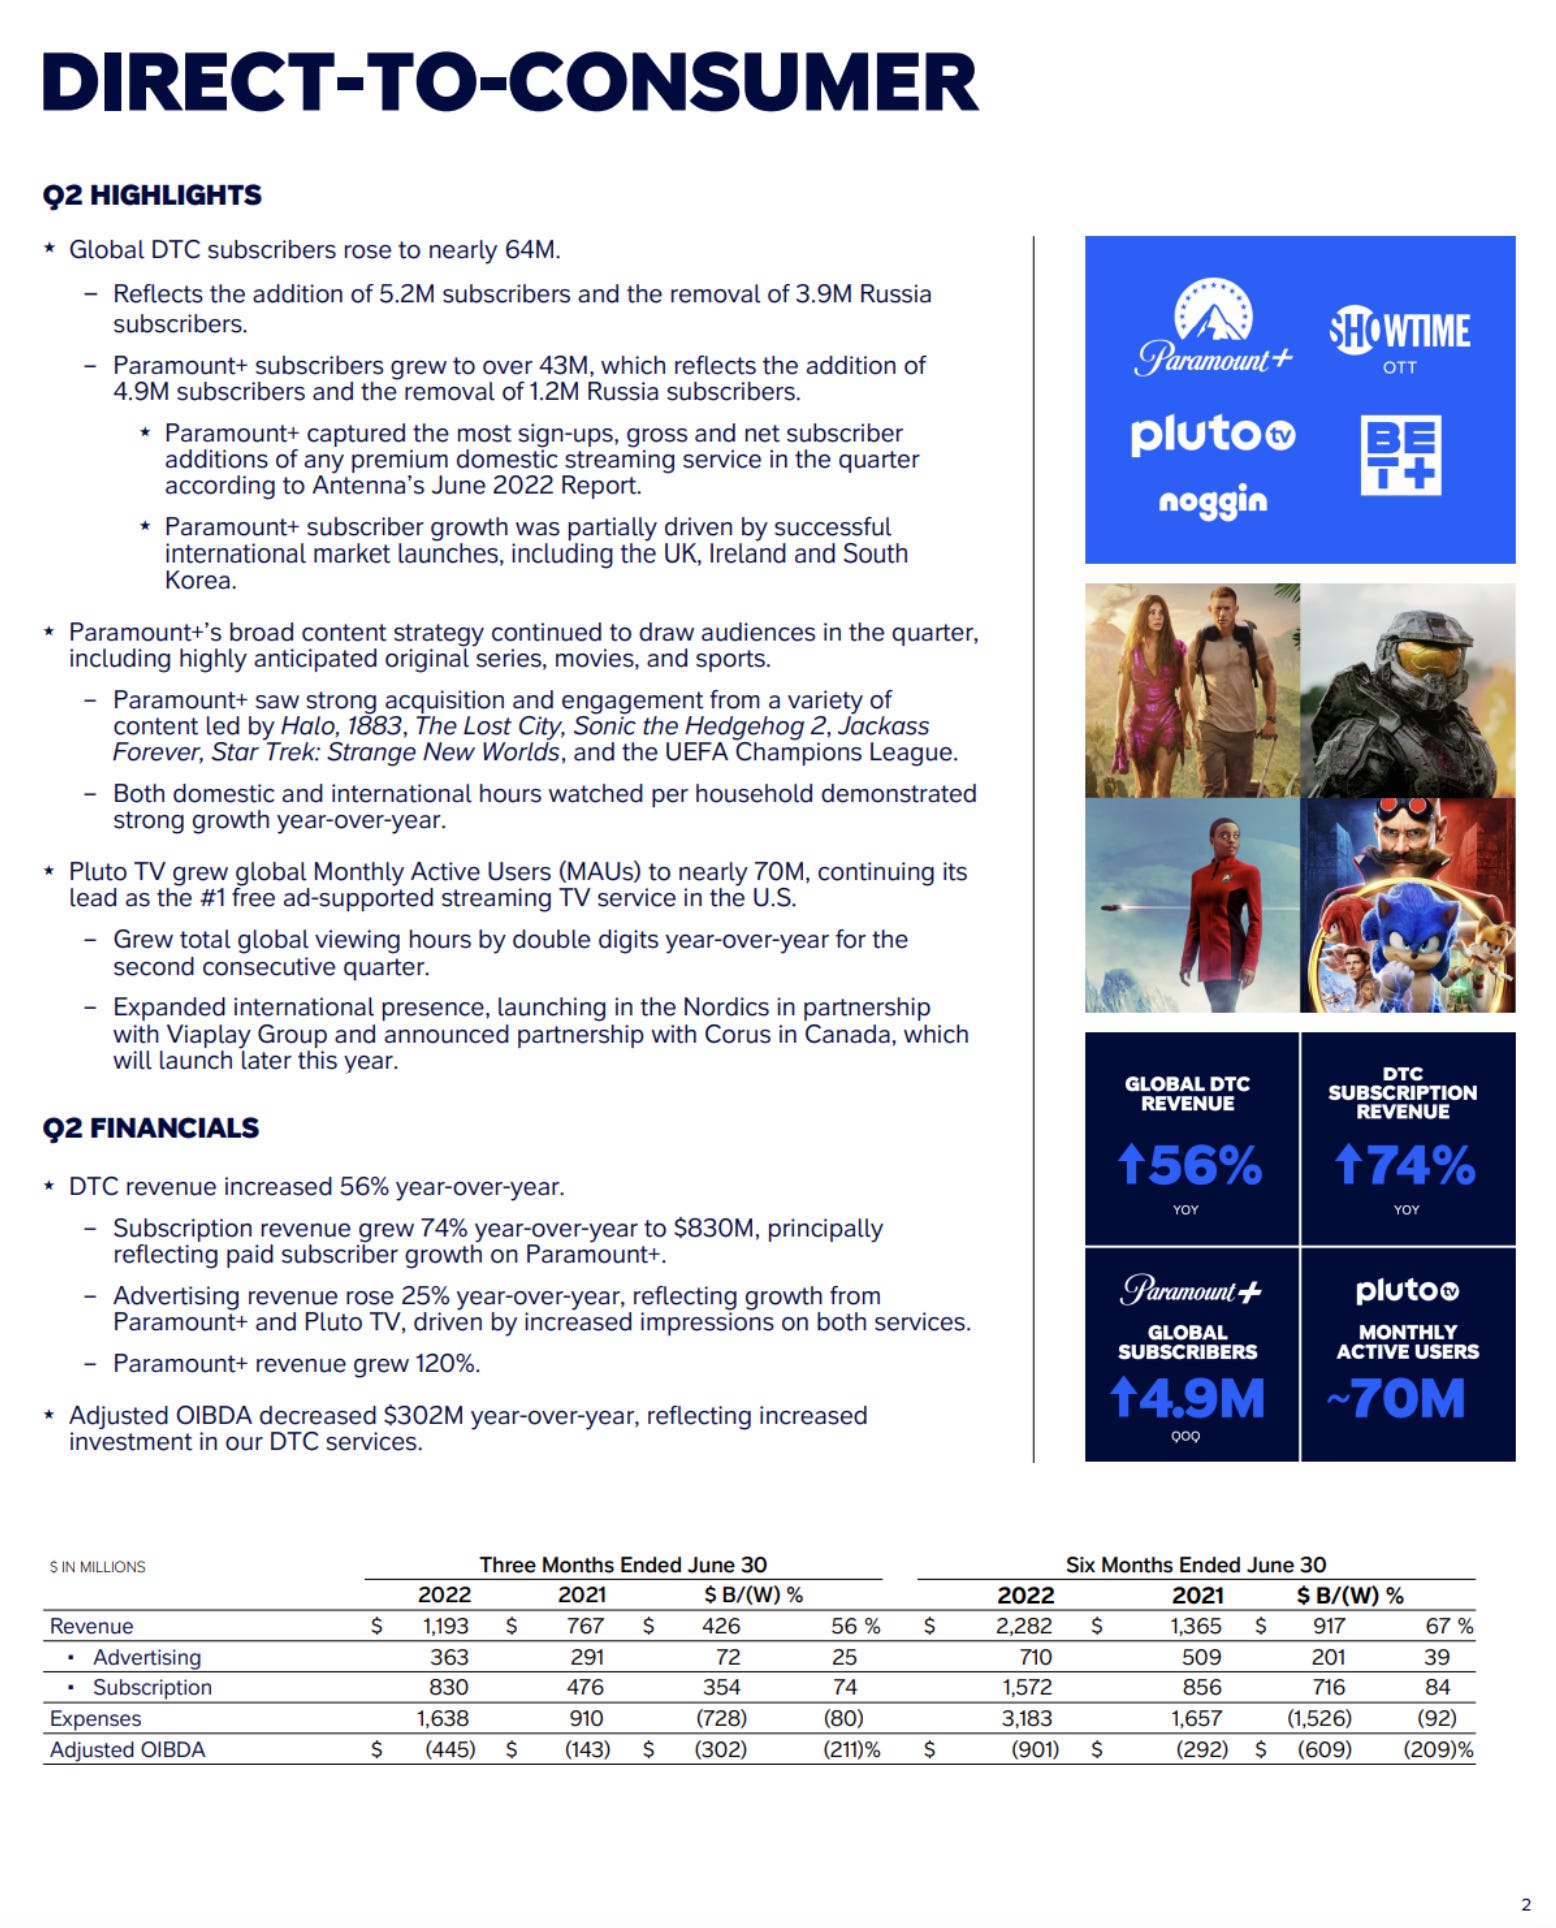
Subscribers: Since Paramount+ is a subscription service, the key metric to track its growth is the number of subscribers. In Q2, 2022, Paramount+ subscribers grew to over 43M, which reflects the addition of 4.9M subscribers and the removal of 1.2M Russian subscribers. In fact, Paramount+ captured the most sign-ups, gross and net subscriber additions of any premium domestic streaming service in the quarter according to Antenna’s June 2022 Report. Paramount+ subscriber growth was partially driven by successful international market launches, including the UK, Ireland and South Korea.
2. Showtime
Showtime is another of PARA’s streaming platforms. When it launched, its purpose was to host shows created specifically for the Showtime TV cable network. It is more of a niche streaming platform meant for fans of the Showtime TV cable network shows.
Price: Showtime, as a standalone streaming service, costs $10.99 per month. However, it can be added to Paramount+ with a cheaper bundle price. Showtime content is accessible within the Paramount+ app. Showtime is also available as an add-on for other streaming services like FuboTV, Hulu, Sling TV, or YouTube TV.
Content: Showtime’s popular shows include “Billions,” “Yellowjackets,” “The Chi” and “Dexter: New Blood.” Showtime offers a variety of sports content, particularly when it comes to non-traditional sports such as MMA and boxing. It seems to me that Showtime is not your run-of-the-mill streaming platform. People who would sign up for showtime are mostly fans of previous Showtime Originals and fans of boxing and MMA. Currently, there are rumours already that PARA plans to fold Showtime into Paramount+.
Subscribers: PARA does not break out Showtime subscribers, which may indicate its impact is less material compared to PARA+ and Pluto TV. Hence, I will ignore it in my further analysis.
3. Pluto TV
PARA acquired Pluto, a FAST (Free Ad-Supported Streaming TV) service, in 2018. A FAST service means that the service is free for everyone to use and only makes its revenues from advertisement. At that time, Pluto’s full-year revenue was only $70 million. Fast forward to 2021, it was just short of $1.1 billion, and it still continues to grow. Today, Pluto TV is the largest FAST service and turned profitable at the end of last year. Yes, profitable! Clearly, there are a lot of people who like free TV and PARA has been quick to cater to them. DIS, WBD and NFLX do not have a similar offering yet. This gives PARA a lead in a space where competitors are still catching up.
Number of monthly active users (MAUs) of Pluto TV worldwide from 2nd quarter 2020 to 2nd quarter 2022(in millions)
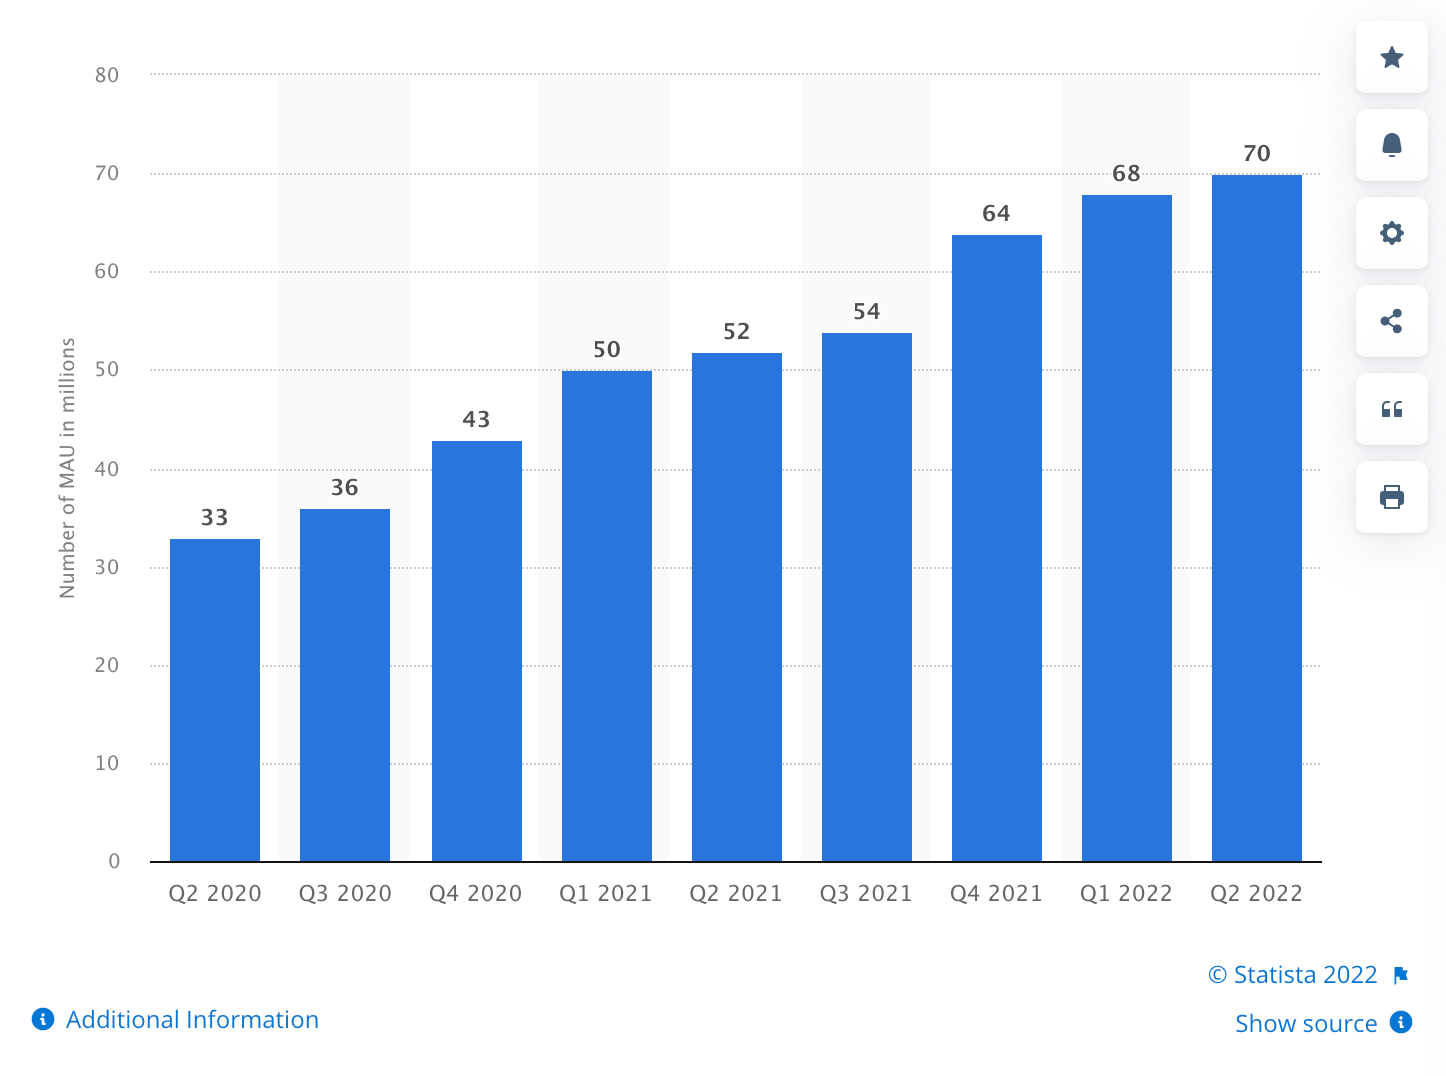
Source: Statista
Price: Pluto TV is a free service for everybody. PARA earns revenue from the platform solely through ads.
Content: Pluto is a place to dump all the old movies and TV shows. These shows have low acquisition strength and adding them to Paramount+ will not marginally increase subscribers, thus PARA’s decision to have a dedicated free streaming service that monetises solely using ads is a smart one.
MAUs: Since Pluto TV is a free service and makes revenue through advertisements, the key metric to track its growth is Monthly Active Users (MAUs) which gives us an insight into how many users are using the platform. In Q2, 2022, Pluto TV grew Global Monthly Active Users (MAUs) to Nearly 70M, extending its Lead as the #1 FAST service in the U.S. It competitors includes The Roku Channel and Tubi TV. PARA defines MAUs as the number of unique devices interacting with the Pluto TV service in a calendar month. Unfortunately, this gives us no information as to how long users are actually spending on the platform.
4. BET+
Black Entertainment Television, BET, is an American basic cable channel targeting African-American audiences. BET+, a joint venture with Tyler Perry Studios, hosts content from the BET cable TV network and is a leading subscription streaming service for the Black community, with thousands of hours of movies, television, stand-up specials, stage plays and more.
Content: BET+ is home to exclusive originals from leading Black creators such as Tracy Oliver’s First Wives Club; Tyler Perry’s Ruthless and Bruh; Carl Weber’s The Family Business; and Will Packer’s Bigger; American Gangster: Trap Queens; All The Queen’s Men; The Ms Pat Show; and Sacrifice.
Subscribers: PARA does not break out BET+ subscribers, which may indicate its impact is less material compared to PARA+ and Pluto TV. Hence, I will ignore it in my further analysis.
5. Noggin
Content: Noggin hosts content from PARA’s Nickelodeon TV network. It markets itself as a preschool subscription streaming service and features over 1,000 library episodes, interactive videos and short-form educational content.
Subscribers: PARA does not break out Noggin subscribers, which may indicate its impact is less material compared to PARA+ and Pluto TV. Hence, I will ignore it in my further analysis.
Therefore, for the purpose of our analysis, we should focus on the growth of PARA+ and PlutoTV, as these are the two flagship streaming services.
Streaming Market Share
Wrapping this up, as of the end of June, PARA had about 64 million D2C subscribers, which includes about 43 million PARA+ subscribers. For what it's worth, that reflects the removal of about 4 million D2C subs in Russia and about 1.2 million of those were PARA+ streamers.
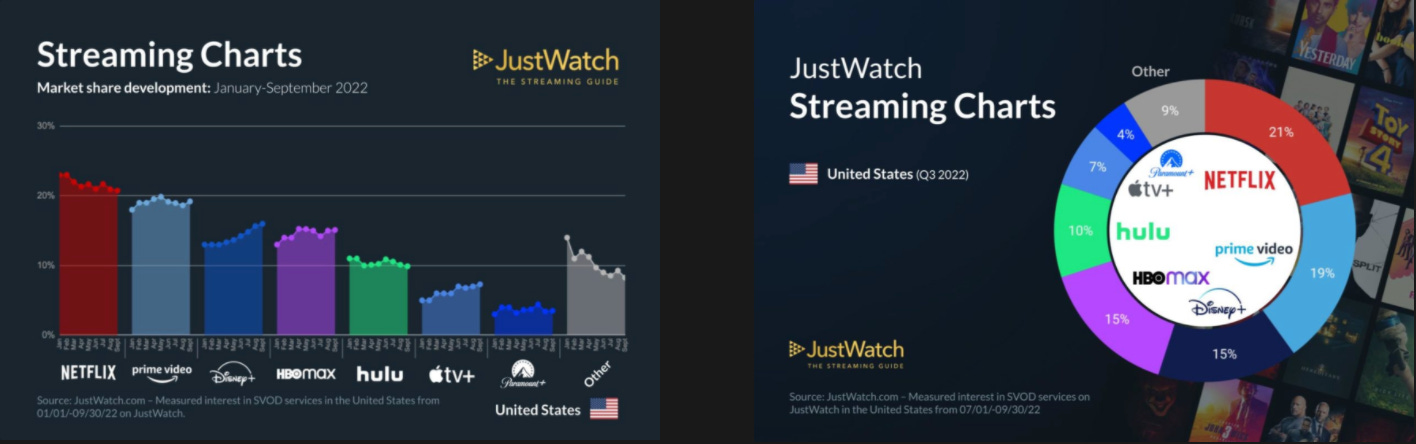
Source: JustWatch
The “market share” in JustWatch’s data above is calculated based on how much interest JustWatch customers have in each streaming platform. Based on the chart above, PARA+ has the 7th largest market share, while PARA’s other streaming services are too small and so considered under Others. Based on this chart, PARA+’s market share has remained flat. Let’s look at another chart.
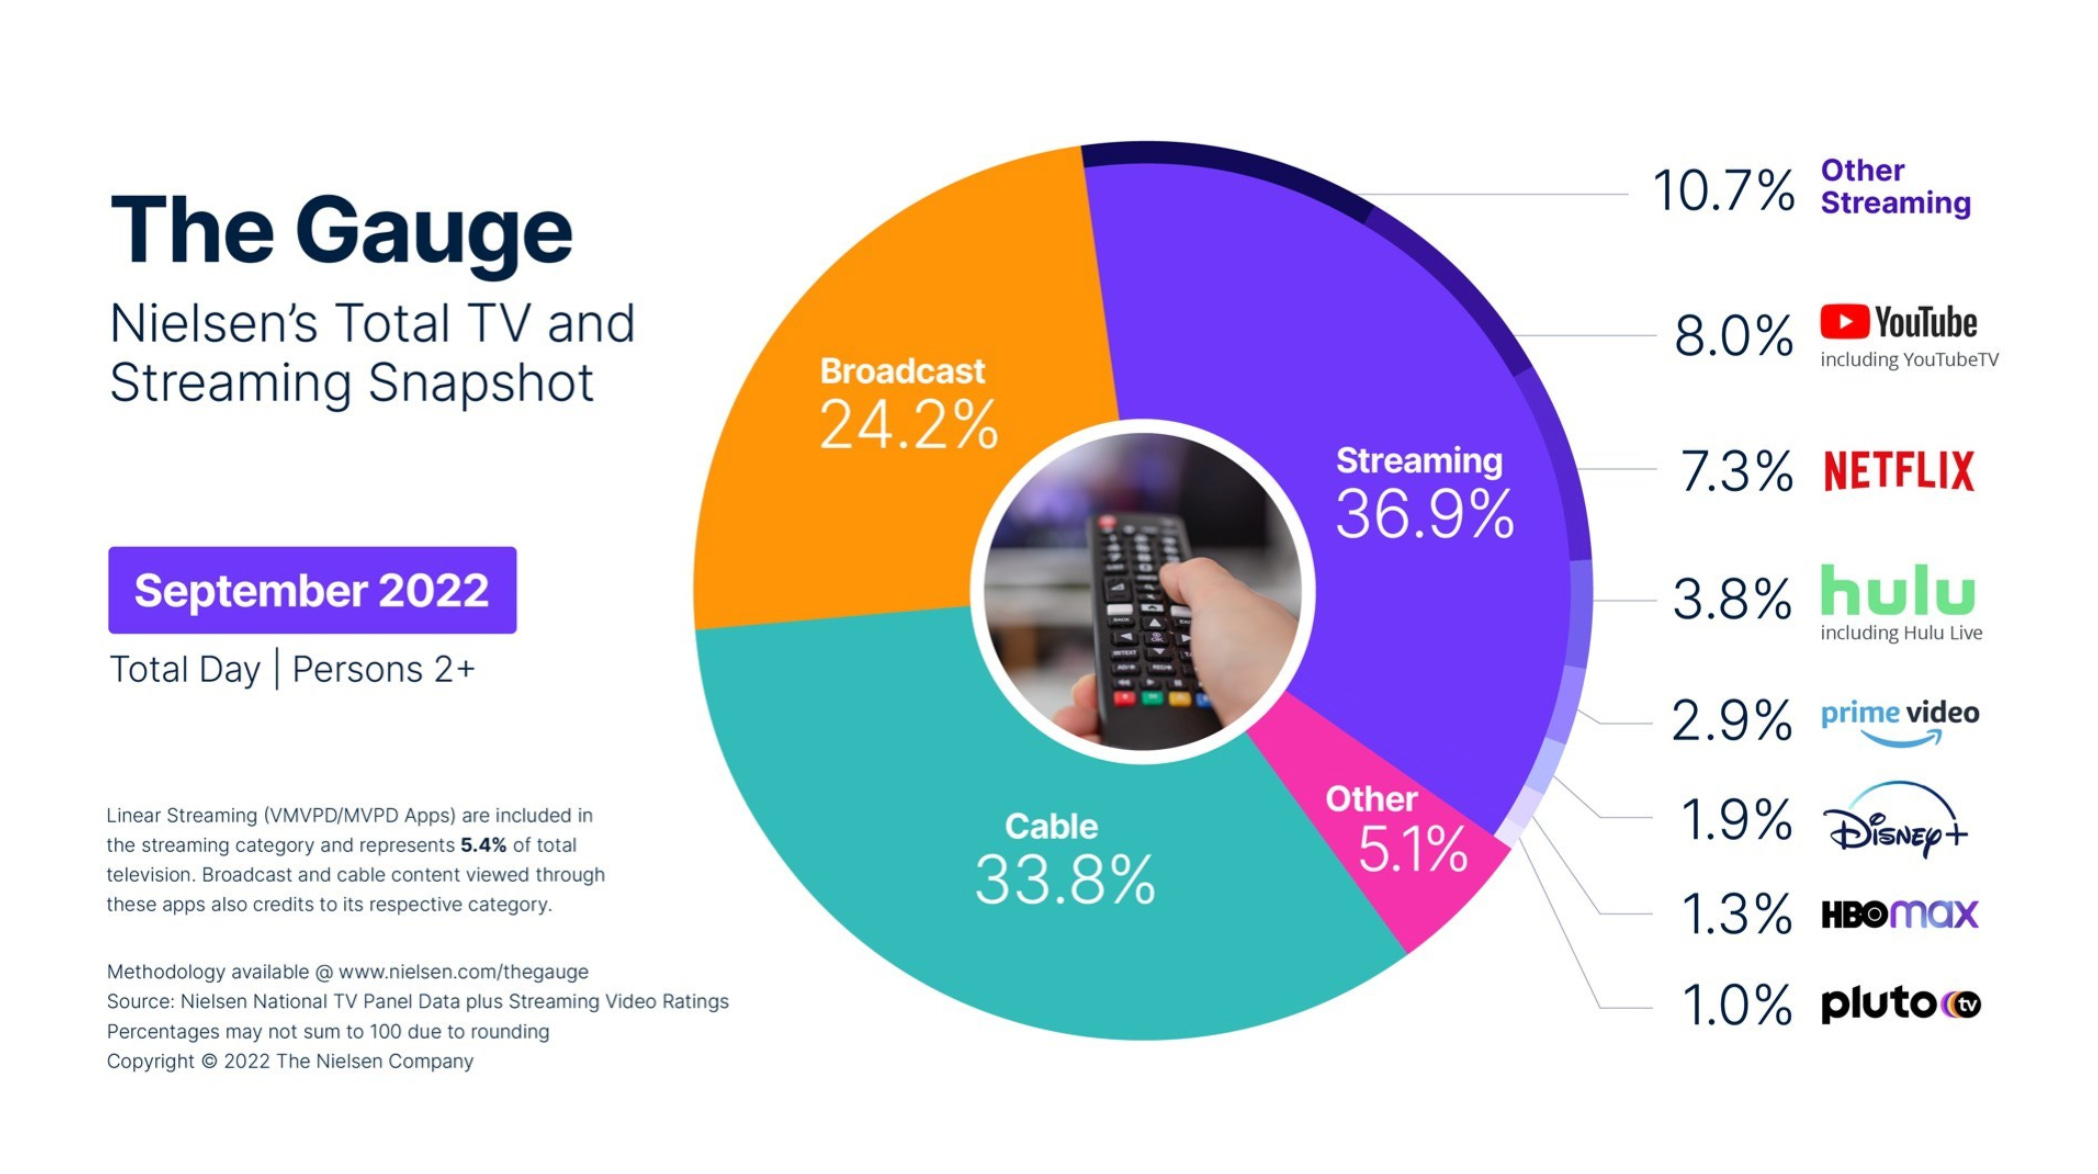
Source: Nielsen
The “market share” in Nielsen’s data above indicates how much of total consumer time is spent on each streaming app across TV platforms only. Based on the chart above, I am glad to see that even as a FAST, Pluto TV has a respectable 1% share of total TV time. On the other hand, PARA+ does not even have a significant market share and is categorized under Others
Therefore so far, we can see how PARA has a good cable market share, but a very small streaming market share.
Coffee Break!
Analysis of PARA’s Content Library
To assess a streaming company’s content portfolio, we have to consider 4 things:
The acquisition strength of its content
The churn rate of its subscribers
The amount spent on producing its content
Current subscriber satisfaction
Ideally, we want a company with a content library that has high acquisition strength, a low subscriber churn rate, and spends prudently on content. Now, let’s find out if PARA has these three characteristics.
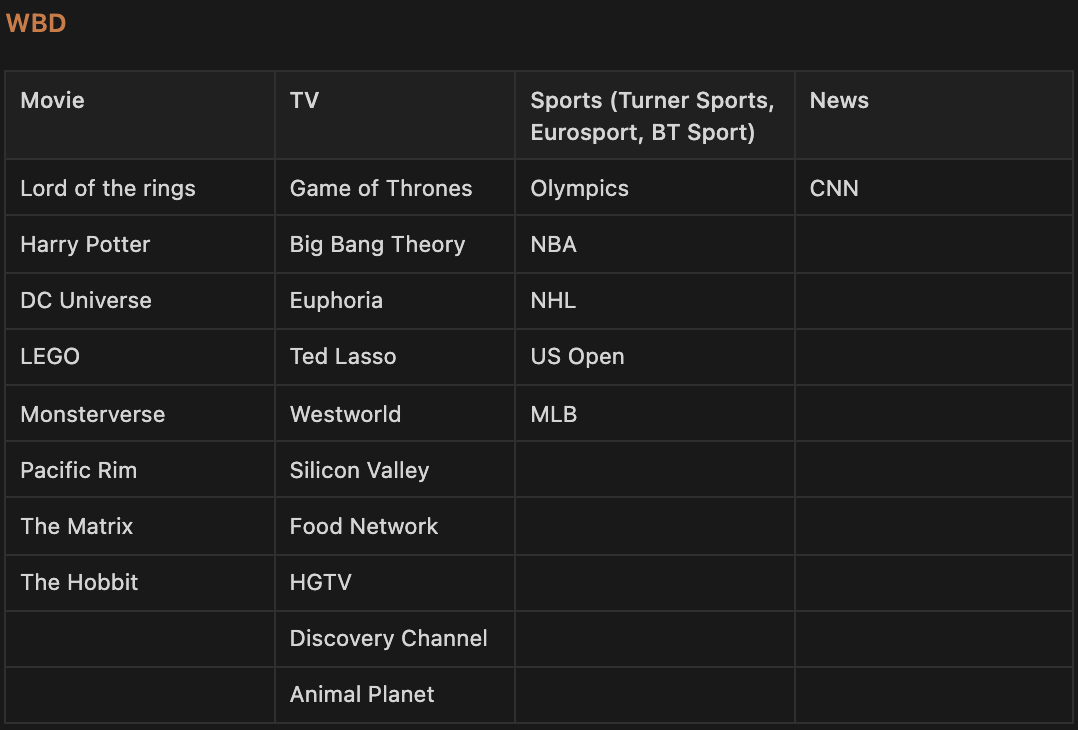
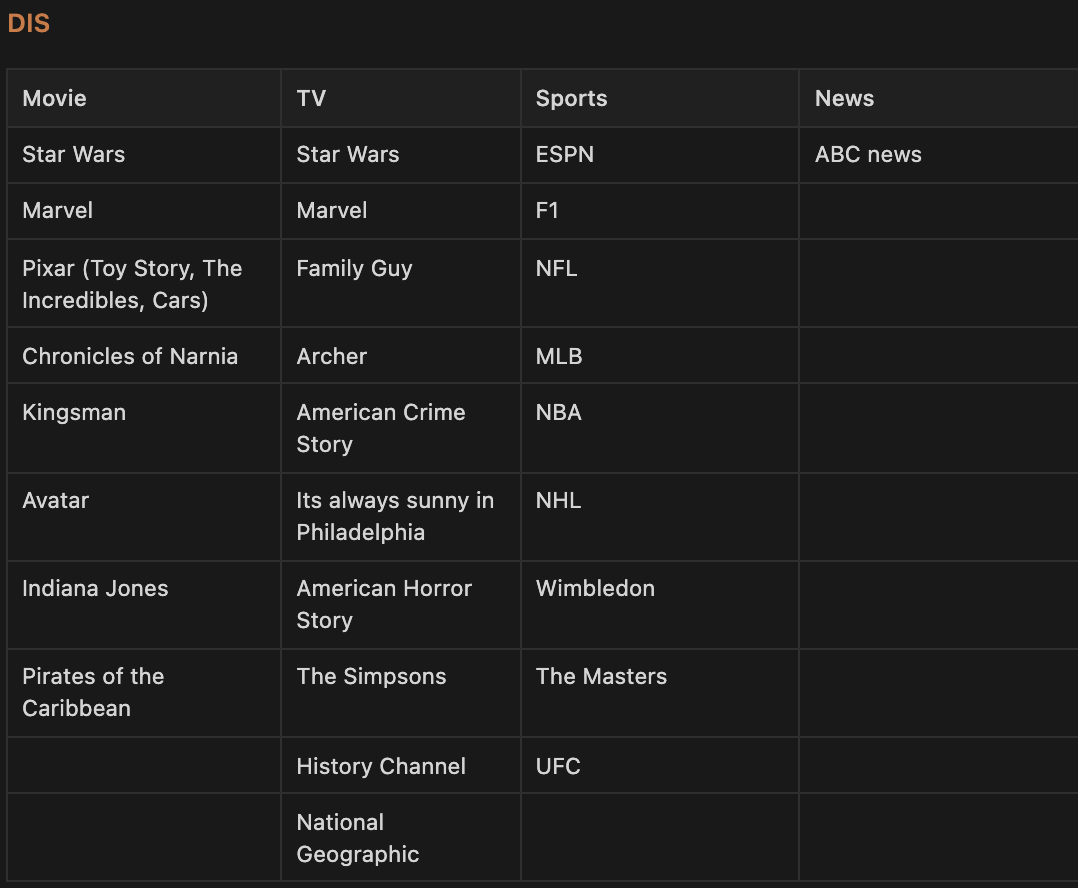
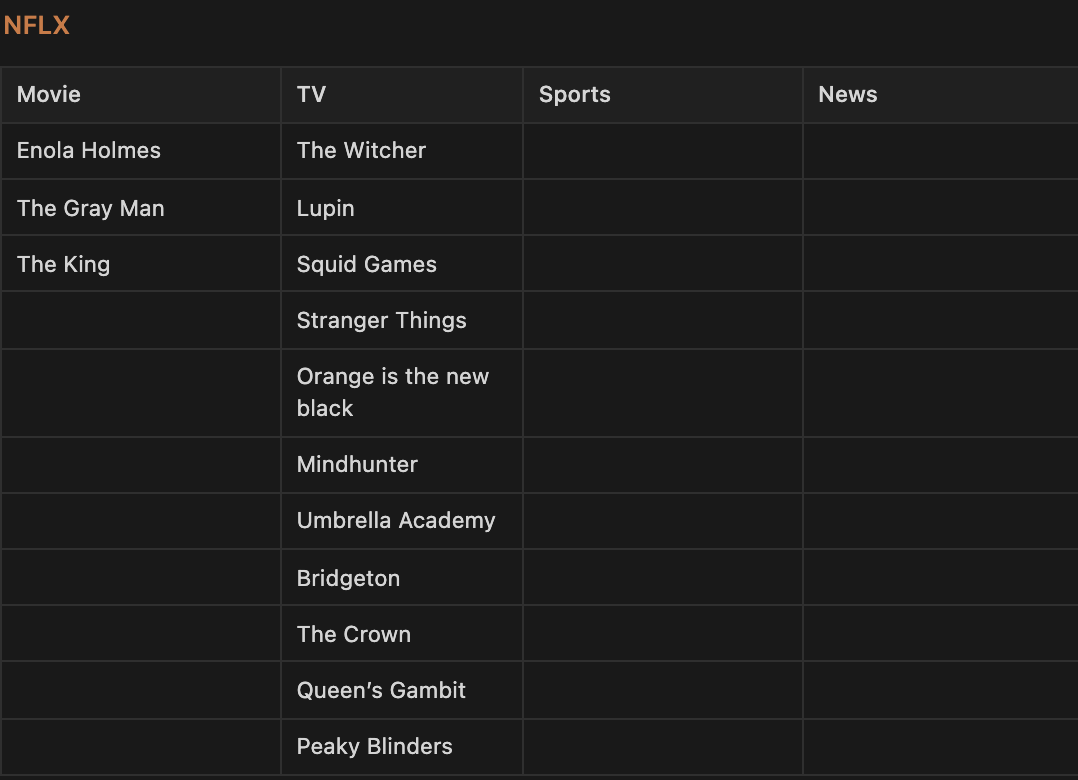
To get a sense of how PARA’s intellectual property fares against its competitors, I have collated the major franchises of each streaming company in the tables below.
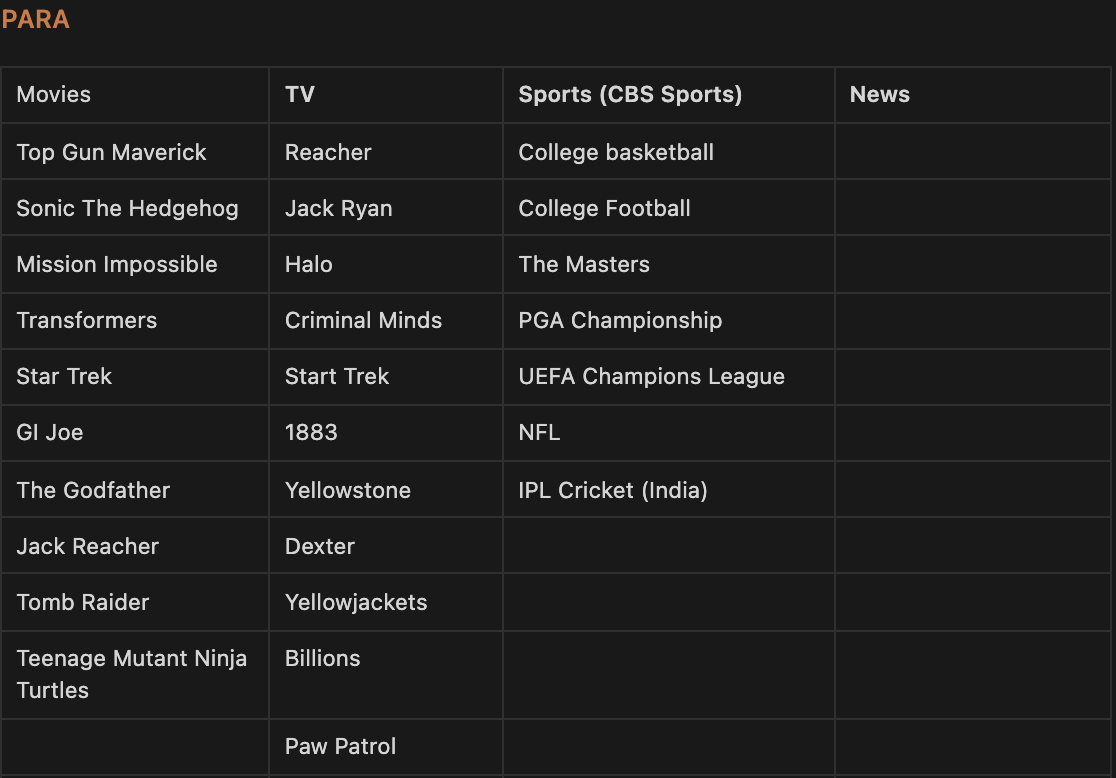
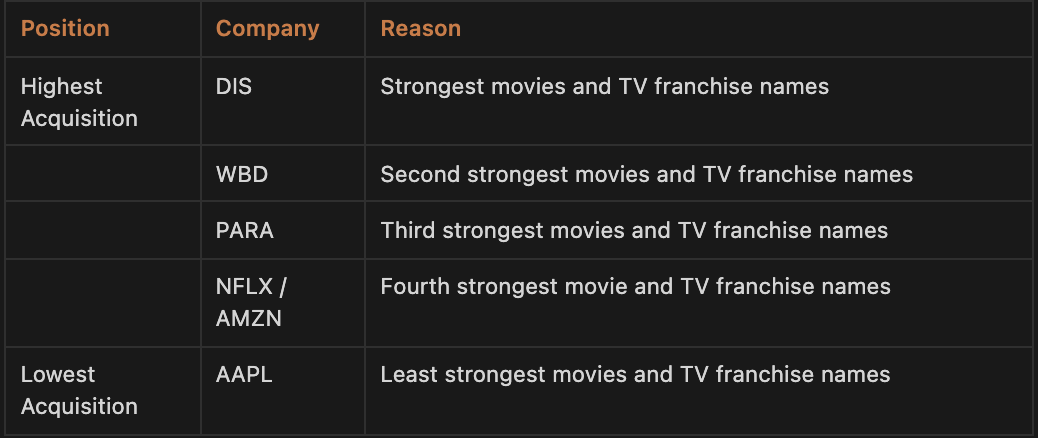
1. Acquisition Strength
To compare acquisition strength, that is the ability of shows to generate excitement and draw in interests of a large number of people, I have decided to use the number of branded movie and TV franchises as the metric. In terms of this metric, Disney definitely takes the first spot. In my WBD deep dive, I ranked WBD as the second-strongest library of franchises and tied PARA and NFLX for last place. However, upon closer analysis PARA’s content, I have to conclude that PARA’s content library has many popular franchises such as Mission Impossible and Star Trek. For example, Paramount’s Top Gun: Maverick garnered record box office numbers. Thus, I would now rank PARA in 3rd place, and NFLX in 4th place in terms of acquisition strength. However, although I did rank them differently, I think that the actual difference between them is minute.
PARA’sschedule for next year consists of high-acquisition content such as Mission Impossible, Transformers, Teenage Mutant Ninja Turtles and Paw Patrol.
Therefore in terms of acquisition strength in 5 years time, we rank them in the order of:
Now, let’s compare their churn rates.
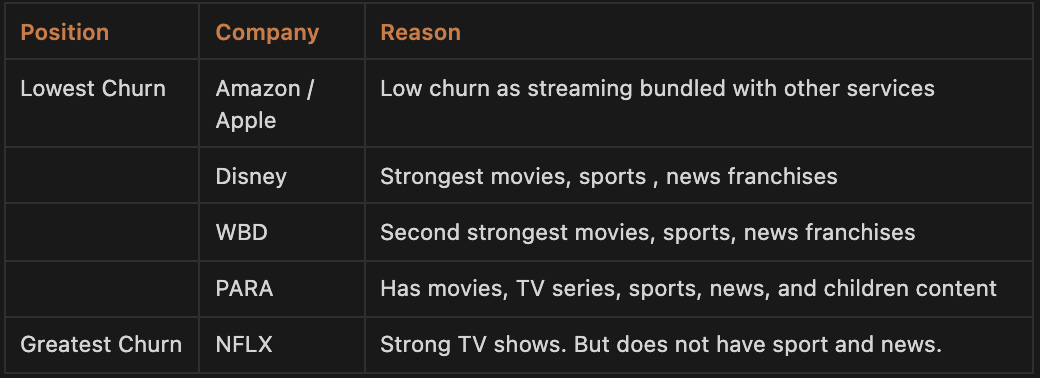
2. Churn Rate
PARA+ reduces churn rate by bundling sports, news and kids’ content with its movies and TV series.
As mentioned in my previous deep dives on streaming companies, sports content is imperative in making the content provider more attractive. Sports guarantee a built-in audience. In terms of sports coverage, Disney is the best. It owns ESPN which is the most popular sports coverage channel. In my last research article, I ranked WBD in second place. However, it now seems to me that PARA has a larger sports offering than WBD. CBS Sports has rights to NFL, Champions League, Serie A, College basketball, PGA Championship, and Masters. WBD comes in third place with its Eurosport and Turner networks that have rights to NBA, NHL and MLB. In this regard, many of the other streaming competitors are at a disadvantage. Netflix, Amazon Prime, and Apple TV all do not have their foot in the realm of sports. If you’d like to see a ranking of the different sports networks, check this link.

Like sports, news helps reduce churn further. Because of its ever-changing nature, people continuously have to keep up to date with new news, and that is why news has very low churn. PARA, WBD and DIS can reduce their churn by incorporating their news channels into their streaming services. In terms of the strength of their news offerings, WBD which owns CNN comes in the first place, followed by DIS and then PARA. NFLX, AMAZN and AAPL tie for last place with zero news exposure.
Paramount also has a lot of kids’ content, specifically focused on Nickolodeon. This means that its streaming platform may be a good alternative to Disney+ and the preferred platform over WBD+ for families with young children.
Therefore in terms of churn rate in 5 years time, we rank them in the order of:
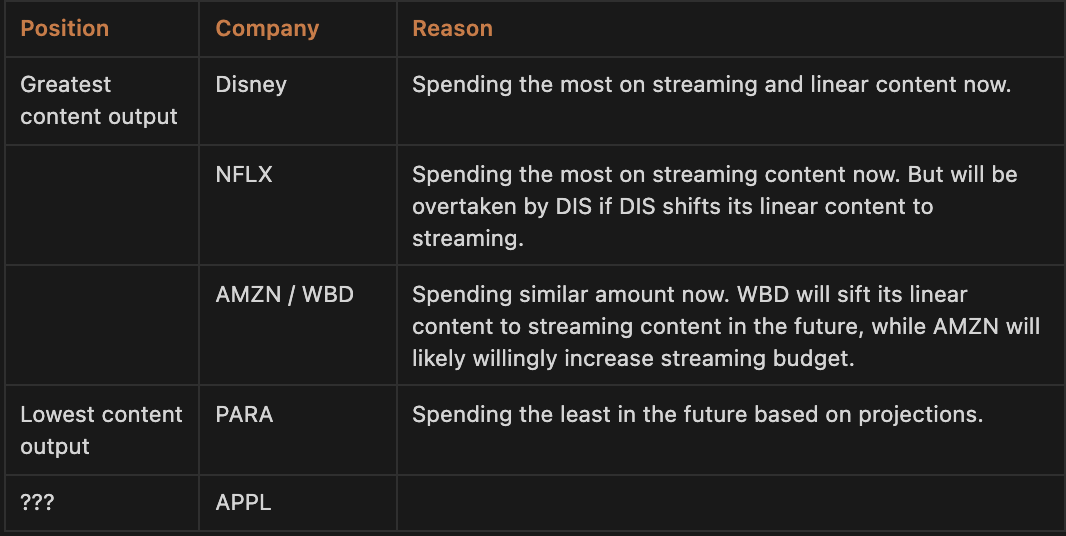
3. Content Spend
Here’s a collation of the content spending among the different streamers.
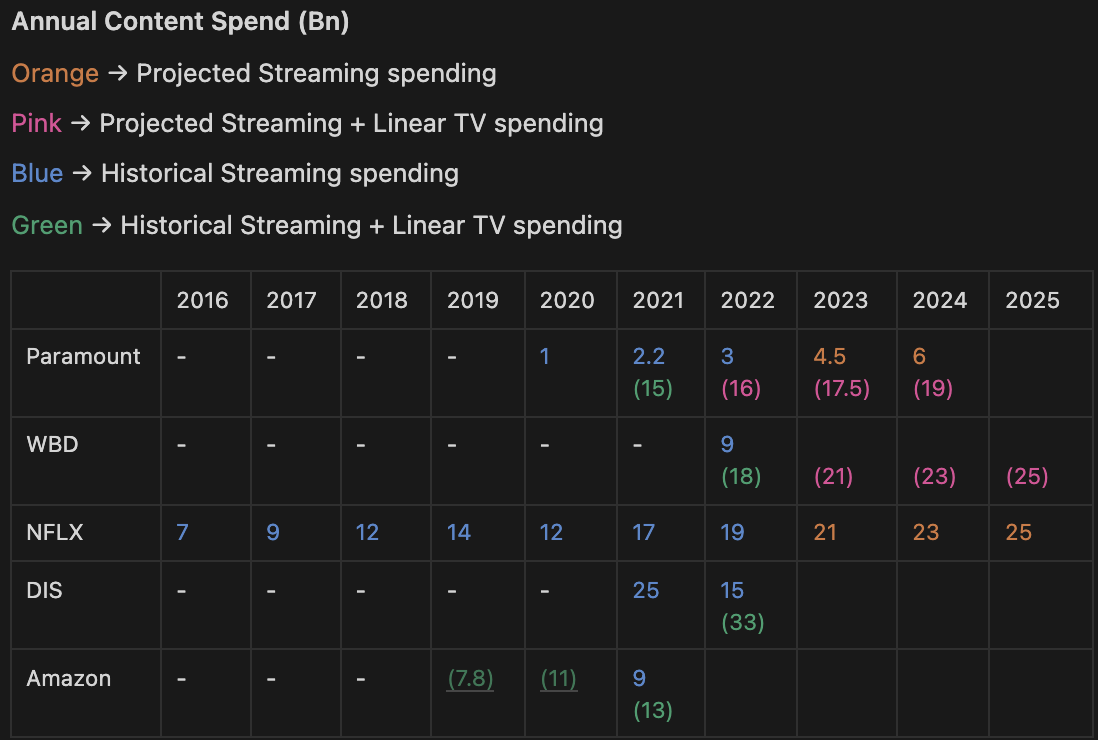
PARA estimated that will spend $3 billion on streaming content this year. It did not give projections for its linear TV content spend, so I will assume that it keeps constant at $13 billion in order to project total spending across the next few years.
PARA streaming content spend is the least amongst its peers. Its estimated 2024 content spending of $6 billion is even less than all its peers streaming budgets for this year. This leads me to conclude that based on content spending, PARA will not become a leading streaming player anytime soon.
Bulls may argue that although PARA is spending only $3 billion on PARA+ originals, it has adopted the strategy of putting its linear TV shows onto the platform as well. On top of that, it is moving all its theatrical releases onto the streaming platform 45 days after their box office releases. This point is valid if you are comparing PARA to NFLX and AMZN. However, all the other traditional media conglomerates like DIS and WBD can adopt the same strategy easily, so it is not an advantage that PARA inherently has.
There is a limit on the number of shows people can watch because of time, relationship, and work constraints. Streaming companies should be mindful of this ceiling when producing shows to keep subscribers entertained. In a previous article, I deduced that the DTC content spending for each player will eventually stabilize at around $25 billion each. (Check out my previous article here for an explanation!). PARA is currently spending a total of $16 billion. Even if most of its content spending will eventually be ported over to streaming, it still lags behind its peers. For context, WBD is already spending $18 billion, NFLX $19 billion, and DIS $33 billion. Only AMZN is behind with a spending of $13 billion, but I doubt AMZN will have any hesitation in increasing its content spending quickly.
Therefore in terms of content spending in the near future, we rank them in order:
4. Customer Satisfaction
According to the survey below, in terms of overall satisfaction, HBO Max currently takes the lead, followed by DIS+, NFLX, PARA+, AAPL, and then AMZN. We can also see that only NFLX lost customer satisfaction from 2021 to 2022, all the other services including PARA+ gained customer satisfaction points.
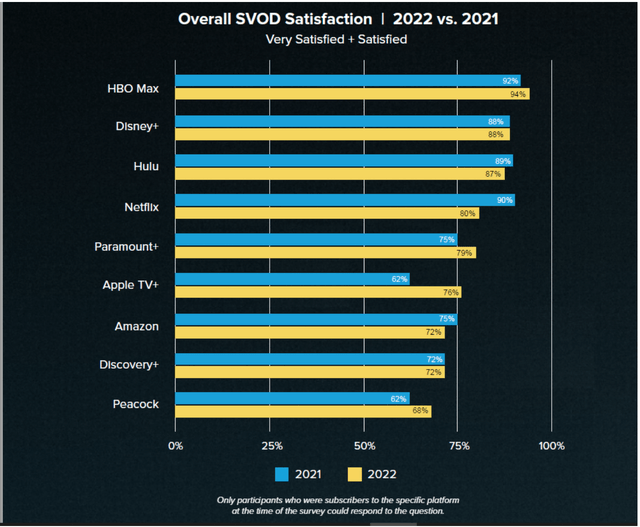
Source: Whip Media 2022 Streaming Satisfaction Report, Variety.com
Below is another survey done by Whip Media that asked subscribers which streaming service they would keep if they only had one choice. NFLX is currently the most popular service, followed by HBO Max, DIS+, AMZN and then PARA+.
NFLX found itself losing 10%, while HBO MAX, DIS and PARA+ found themselves gaining ground. However, among the three of them, PARA gained the least ground of only 1%.
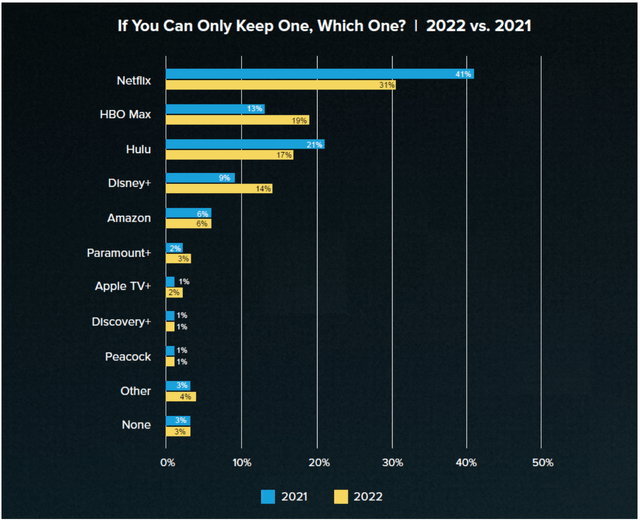
Source: Whip Media 2022 Streaming Satisfaction Report, Variety.com
Content Library Analysis Conclusion
Based on our analysis above, we estimate that PARA will likely have the third-strongest content library in 5 years.
I find it hard to distinguish PARA, NFLX and AMZN. This is because while PARA has more well-known franchises, sports and news content, NFLX is spending so much more than PARA. AMZN is a wild card. Because it bundled Prime Video with numerous other services, its subscription is very attractive to customers. However, with the company pursuing growth in so many other verticals, it is hard to determine how much funds it will eventually pour into streaming.
Coffee Break!
Analysis of PARA’s Declining Cable Business
How fast is Linear TV Declining?
Cable subscriptions have indeed been declining fast. Here are some stats:
According to Nielsen ratings, TV viewing has been dropping about 10% per quarter.
In total, major US cable TV and satellite TV have lost 25 million subscribers since 2012, and are projected to lose another 25 million by 2025. That’s a doubling declining rate!
Adults ages 18 through 29 are the largest age group without cable, with 34% of them not having subscriptions to satellite or cable TV services. It seems that the younger generation defaults straight to streaming and do not even consider cable TV as an option for content consumption.
Will PARA’s cable business drag down the company? Maybe not!
1. Although Cable revenues are declining fast, Streaming revenues are growing faster.
Consumer spending on pay TV and streaming video in the United States from 2016 to 2026 ($ billion)
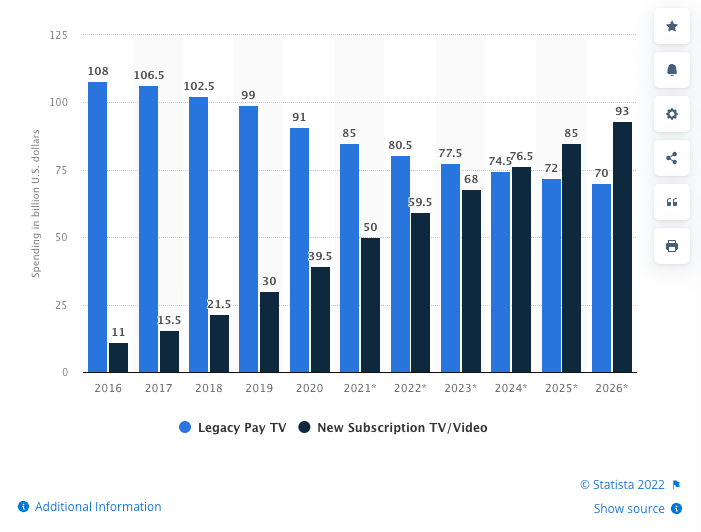
Note: The graph refers to revenues earned and not the number of subscribers.
Based on the above projections by Statista, a company that engages in both cable TV and streaming would experience net revenue growth. This is because revenue growth from Streaming would outpace revenue lost from Cable TV. This may mean that companies like PARA, WBD and DIS would experience a 36% revenue growth from 2016 to 2026, a CAGR of 3.2%.
I must clarify that the projections above only take account of revenue from subscription costs and not revenues gained from ads. Since ads will become more personalized in the streaming world, we can assume that ad revenue generated from streaming services will be greater than from cable tv services. For example, PARA’s competitor, WBD’s Discovery+ streaming service makes $11 a US subscriber from a $5 monthly fee and over $6 in advertising for only 3 minutes of ad time vs. $7 from their Cable TV services. This is 57% higher. It was no surprise therefore that WBD CEO stated, “If we lost a million [cable] subs…all we need to do is pick up 650,000 [streaming] subs in order to be making more money.”
Naveen Chopra, PARA’s CFO, confirmed this in the Q2 Earnings Call “we proactively restructured key affiliate deals, resulting in a shift of revenue from our Pay TV to D2C services. Over the term of these deals, the reduction in TV Media affiliate revenue is expected to be more than offset by revenue generated from our Paramount+ hard bundle relationships, resulting in net growth to the company.”
2. PARA’s Network Gems
PARA owns 5 major TV Networks. They are:
CBS
Showtime
MTV Entertainment
Nickelodeon
Paramount Network
Below is how many primetime viewerships each cable channel lost:
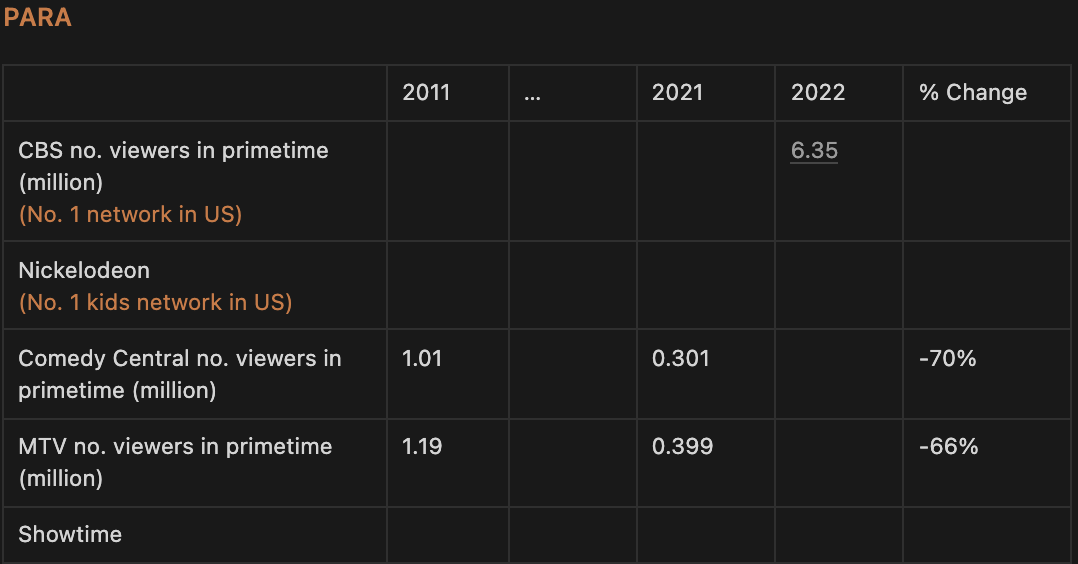
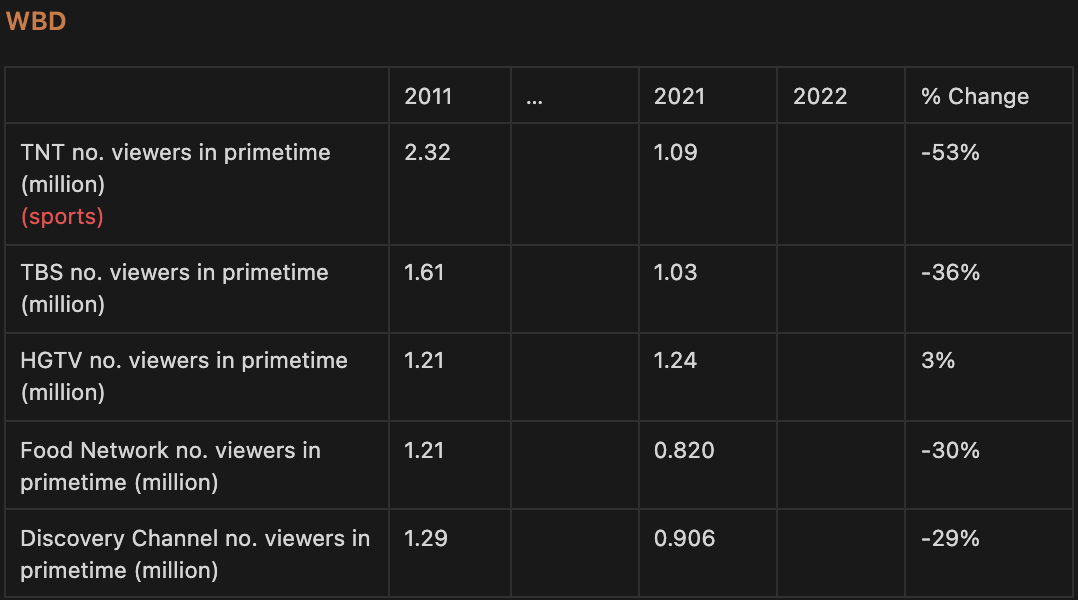
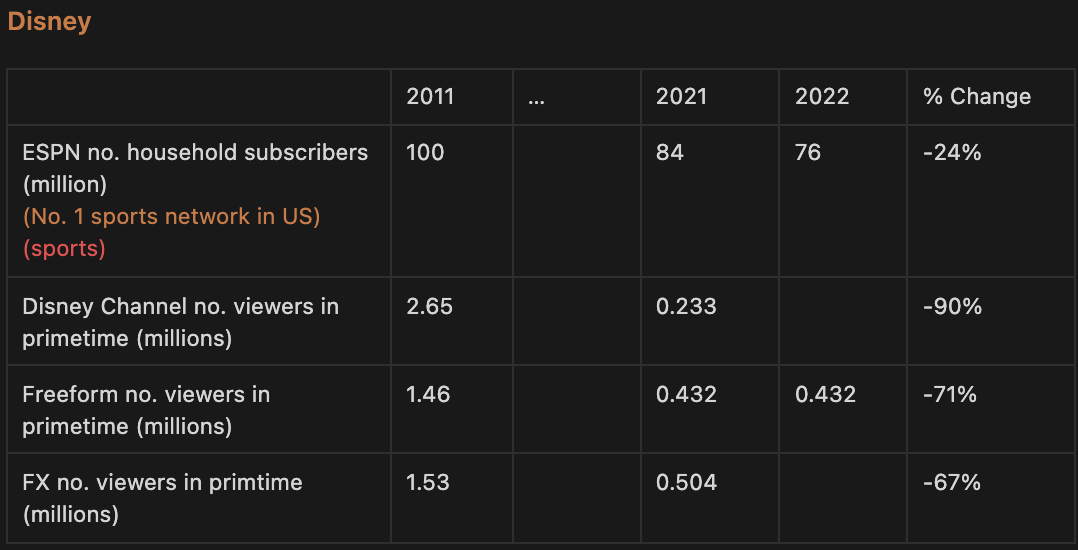
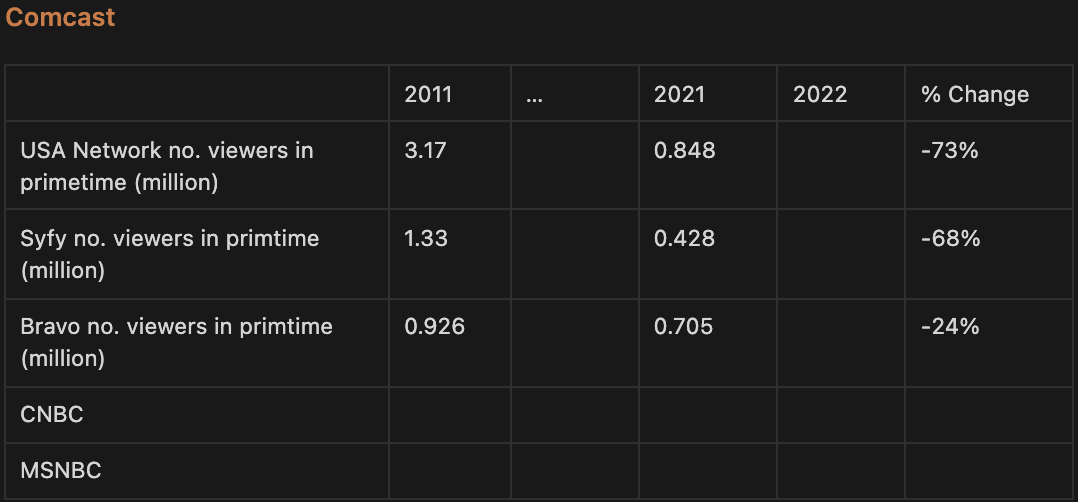
The average viewership drop-off amongst all networks stands at 75%. PARA’s Comedy Central, Showtime, and MTV have all experienced drastic declines in line with the general linear TV market. However, the company does have 2 gems, CBS and Nickelodeon. CBS was the most-watched network last quarter, while Nickelodeon was the number 1 kids’ channel. Personally, I think they make up for PARA’s other networks and so I would rate their cable business on par with WBD’s cable business. Therefore, like WBD we can expect PARA to earn greater revenues above its peers who may potentially have a CAGR of 3.2%. In fact, I am anticipating a CAGR of 3.5-5% for PARA.
3. PARA has the advantage of earning double earnings during its transition
Distribution of cord cutters in the United States in 2020 and 2021, by age group
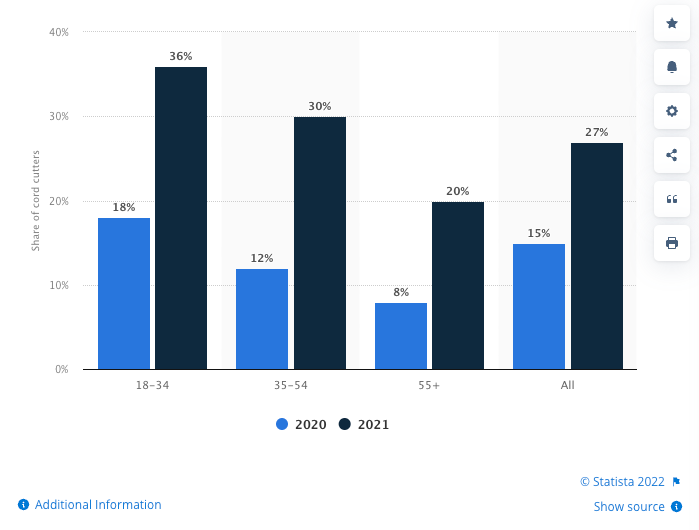
As can be seen from the graph, younger generations embrace streaming services faster than older generations do. Because of this lag in the adoption of streaming between the various age groups, there will be a period where households subscribe to both streaming as well as cable services. This means companies like PARA, DIS and WBD can earn “double” the revenues for each show that it creates. PARA’s shows like Star Trek can air on both PARA+ and Linear TV, while NFLX can only air them on one platform. By “double” I do not mean exactly two times the revenues, but rather more than 1 time.
Moreover, viewers who aren’t cutting the cord aren’t necessarily only watching cable and satellite TV content. Currently, 56% of Americans say they watch cable or satellite TV, while 78% of U.S. households have subscriptions to Netflix, Amazon Prime, or Disney+. This clearly indicates that there is an overlap between streaming and linear TV consumers. Knowing this, would you prefer owning a company that can only distribute its shows on its streaming platform or a company that can distribute its shows on both Linear TV and Streaming?
It is also important to differentiate between subscribers and viewership. Subscriber refers to the number of people who pay for the service, while viewership refers to the number of people who view the shows. Today, Netflix has more viewers than cable and satellite TV combined. However, cable still leads in terms of the number of subscribers. That is why subscribers are still spending more on pay TV than streaming. This goes to show that the cable TV space is still a highly lucrative market, and suggests that although people spend more time on streaming platforms than on cable TV, they are unwilling to cancel their cable subscriptions perhaps because of some shows that are only aired there. Take for example sports, news and reality TV. The inflexion point where streaming will overtake Linear TV in consumer spending is only expected to occur in 2024. Therefore owning a company that has access to lucrative residual revenues from Linear TV as well as exposure to streaming is a smart move.
Brian Robbins, President of Nickelodeon said “when it comes to kids, linear television has obviously been declining for a while now. But what we've seen is if you take our linear share and the audience for kids that we've picked up on Paramount+, we actually have more audience and share of kids 2 to 11 than we've had in years when you combine them both. That's powerful.”
Declining Cable Business Analysis Conclusion
Declining linear TV revenues is not a bad thing for PARA. Linear TV and Streaming are just methods of distribution of content. Having more distribution methods is more beneficial for content-producing companies. Moreover, not only is the rise of streaming faster than the decline of cable, but PARA also owns the best cable network (CBS) and the number 1 kids network (Nickelodeon). Therefore, I can conclude that PARA’s declining cable business, will not drag it down, but give it the fuel to successfully develop its streaming engine. If you asked me whether PARA or WBD has a better linear TV business, I would rank them as equals.
Coffee Break!
Analysis of Management’s Strategy
Management has adopted the following two broad strategies and their corresponding sub-strategies:
Maximise Distribution Channels
45-day theatre window
Taking popular streaming Originals and putting them into theatres
Funnel customers through the different streaming platforms
Expand Through Partnerships
Expand the platform internationally through partnerships
Bundling PARA+ with other services
Here’s a more detailed explanation!
1. Maximise Distribution Channels
45 Theatre Window
PARA has adopted the strategy of releasing its blockbuster movies in theatres for a window of 45 days, before moving them to PARA+. The reason for this strategy is as follows:
In general, 45 days, you've got your money out of theatrical and now you can roll into streaming. You benefit from all the theatrical marketing and the contents viewed as a real movie by consumers, and it's still fresh and it crushes it in streaming. Every one of our films to date has performed very well in box office and on streaming.
Not only does this strategy maximise revenues, but it also allows box office hits to help market the company’s streaming platform. As Brian Robbins, CEO of PARA studio said “So the bigger the hit in theatres, the greater the impact in streaming.” I approve of this strategy, however, it is not something exclusive to PARA, as WBD and DIS can copy this strategy too.
Taking Popular Content And Putting It Into Theatres
Another strategy that PARA has recently implemented is to take popular streaming Originals and put them into theatres. I never saw this move coming. However, it makes perfect sense. Putting shows into theatres requires expensive marketing campaigns to make the desired returns on investment. Previously, Studios could not be sure whether movies they released into theatres will be hits or flops, as only a small circle of people would review and give feedback on the movies before their release. However, this changes now. PARA can use its streaming platform as a testbed for the reception of their Originals and gather data on the movies. Movies that resonate well with their streaming audience, have a higher chance of succeeding at the box office and so are deemed more worthy of the expensive marketing costs to put a movie into theatres. In short, it allows a better return on investments. Brian Robbins said:
We have a movie coming out September 30 called Smile. It's a thriller horror film. This is a movie -- it was a little movie with the first-time director that we made for streaming. We tested the movie. The movie scored so well. I mean crazy well and played so well that we looked at each other and said, we have to release this movie theatrically.
Less than two weeks after its release, Smile made over $100 million at the global box office. The landmark was crossed after opening at #1 in fifteen markets and growing to #1 in twenty-four in its second week. Smile became Paramount Pictures’ sixth #1 movie of the year. It seems that this strategy is effective.
PARA may have pioneered this strategy, however, you can be sure that the other streaming players will follow. No matter, it shows us how useful it is to be engaged in all forms of distribution channels.
Funnel Customers Though The Different Streaming Platforms
PARA uses Pluto, its FAST service, as a top-of-the-funnel device to introduce people to shows on PARA+. For example, when a viewer is watching a free show on Pluto, he might be shown the trailer of a series on PARA+, et cetera. In addition to advertising on Pluto, management also advertises its streaming platforms on its traditional TV networks. Brian Robbins:
“So when you look at Top Gun and you think about how we kicked the campaign off last year, opening the AFC Championship Game, which is the second-highest football game of the year with a 2-minute Tom Cruise opening with Top Gun or with Scream last year where all of our Cable Networks took all the previous Scream movies and roadblock them across all of its Cable Networks for 2 weeks before that movie came out and all the shoulder content with that or what Nickelodeon was able to do to make PAW Patrol fly. This is valuable in such an almost intangible way, and there are not a lot of other companies that have that. So that's what I've been very focused on, and I think that's had a lot to do with our success over the last 2 years.”
Marketing is where traditional media companies truly stand out. If you have many distribution channels, why not use hit content on one channel to synergistically improve engagement on another platform?
2. Expand Through Partnerships
Expand Platform Internationally Through Partnerships
PARA is currently in the midst of rolling PARA+ internationally.
With the help of Sky, PARA+ was launched in the UK, Ireland and Italy.
With the help of CJ Entertainment, PARA+ was launched in South Korea.
With the help of Sky, PARA+ plans to launch in Germany, Austria and Switzerland later this year.
With the help of CANAL+, PARA+ plans to launch in France later this year.
With the help of Viacom18 and Reliance, PARA+ plans to launch in India
With the help of Viaplay Group and Corus, Pluto TV plans to launch in the Nordics and Canada
Source: Q2 Earnings Call
According to management, “Hard bundle deals like these allow us to quickly unlock a healthy volume of subscribers at 0 acquisition cost and with very low churn.” With all the ongoing international rollouts, management expects that by the end of the year, inclusive of Paramount+ and Sky Showtime, their SVOD services will be available in 60 total markets. It seems that PARA will see strong subscriber growth in Q3 and Q4.
Bundling PARA+ With Other Services
In August 2022, Paramount inked a deal with Walmart (WMT). The deal will see Walmart+ members gaining access to Paramount+ Essential Plan subscription, while its own membership pricing would stay the same at $98 per year. (Typically, the Essential Plan is $4.99/month., and $59/year) This deal is beneficial for WMT because provides WMT with a more competitive offering to rival that of Amazon Prime. For PARA, the deal gives it a moat amidst an increasingly crowded streaming landscape. I never saw this coming, but I love that it did.
According to Consumer Intelligence Research Partners (CIRP), Walmart+ membership subscriptions currently stands at 11 million customers in the U.S. If all WMT+ members use PARA+, PARA immediately bumps its subscriber number from 43 million to 54 million. This will definitely be a catalyst for Q3 and Q4 earnings reports.
Brian Robbins said:
“I believe that the partnership is going to be really robust. I think they're in the early days of Walmart+ and the combination that I know of the marketing campaign that's about to kick in from them and from us, I think you're going to see growth for Walmart+ in a big way as they lean into scaling that service for their customers. And in turn, we're going to benefit from it. And hopefully, we're going to not only drive consumers to Walmart+, but we're going to drive traffic in stores with things like our Teenage Mutant Ninja Turtles movie next year in PAW Patrol and Yellowstone, et cetera.”
The pact allows Walmart to sell ad slots on Paramount-owned services such as PARA+ and Pluto as part of larger advertising deals, the people said. Walmart promotes PARA+ programming—including shows such as “Paw Patrol” and movies such as “Top Gun: Maverick”—on the smart TVs in its stores as well as on its website. Walmart also promotes Paramount+ on self-checkout screens in stores and gives customers an option to subscribe to Walmart+ as well.
Management’s Strategy Analysis Conclusion
In our earlier content analysis, we saw how PARA’s streaming budget is far below its peers. Moreover, in the customer satisfaction surveys, we saw how PARA currently ranks lower than its peers. Thus, I would be less optimistic if management’s strategy was one of operating PARA+ as a lone streaming platform. Instead, management is clear about its weakness of small content spending and appears to cope with this by bundling its offering with other services and leveraging partners to expand. In my opinion, this is the right strategy for PARA.
However, although PARA’s strategy may sound appealing to investors, its competitors can easily adopt such a strategy as well. Already, there are rumours that Costco is also discussing partnerships with some streaming services over the past year. Other current partnerships include:
T-Mobile now offers both free Netflix and Apple TV+ and a year of free Paramount+ for subscribers on its top-tier unlimited wireless plan.
Verizon now offers the Disney bundle free to customers on its priciest mobile-phone plans. The two companies have been partners since Disney+ launched in 2019.
It is also wise to remember that acquiring a customer through a bundle is only part of the challenge. The real goal is to turn those bundle subscribers into active users. You need the eyeballs on the platform to earn the advertising revenue, which these cheaper subscription tiers rely on.
Coffee Break!
Analysis of PARA’s Liquidity Health
PARA’s huge debt is a major reason why many investors shy away from the company. Let’s dig in deeper below!
How Much Debt Does PARA Have?
PARA has a total debt figure of $17 billion. Compared to its peers, its debt levels are on the higher end relative to the market cap. In an increasing interest rate environment and an anticipated economic downturn, companies with high debt levels are more at risk of going bankrupt. As such, the market has punished the stock. But let’s dig more into it.
How Much Debt Is Due To Mature Soon?
According to PARA’s website, 90% of the company’s debt has maturities after 2026. This is a much better debt profile than WBD has. Its long maturity profile gives ample time for PARA to transition from a cable company to a streaming company.
Management Expectations
According to Naveen Chopra, PARA’s CFO, “Turning to the balance sheet, we finished the quarter with $4 billion of cash on hand and total debt of $15.8 billion. We continue to maintain significant financial flexibility, which will increase with the addition of proceeds from the sale of Simon & Schuster &. We also maintained a committed $3.5 billion credit facility that remains undrawn.”
However, I must point out that the sale of Simon & Schuster is currently facing regulatory pushback and may not go through.
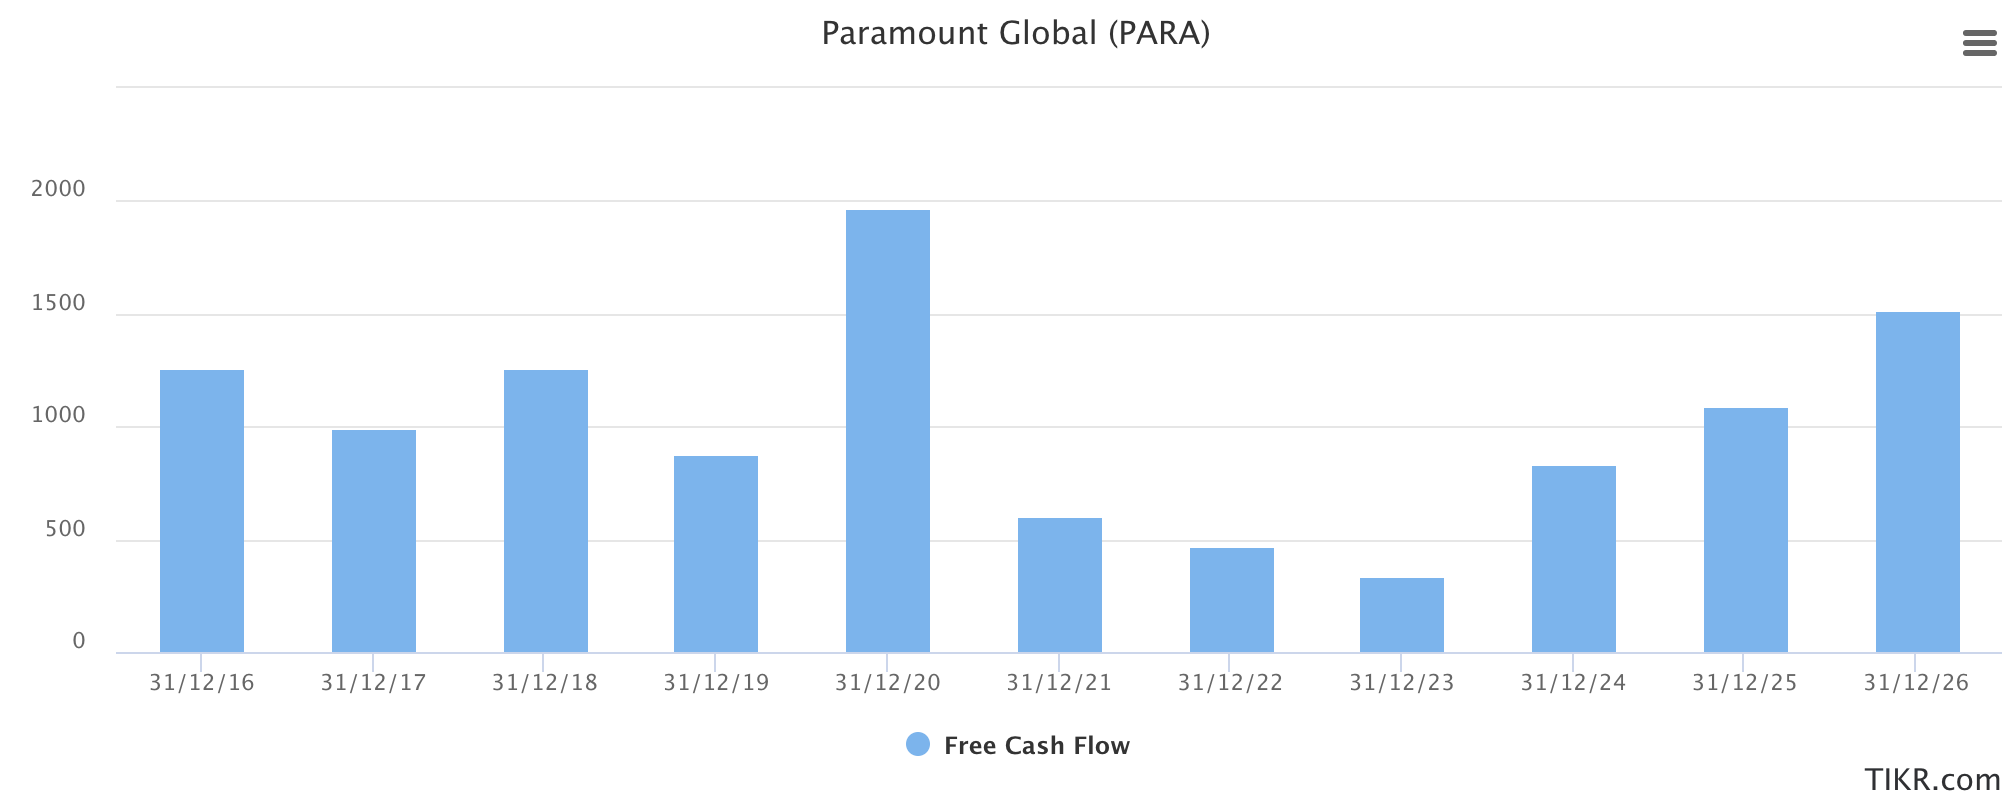
Will FCF Be Able To Cover Near-Term Debt?
PARA has around $1.7 billion of debt due before 2026. Based on analyst projections of FCF in the diagram below, PARA should be able to pay off its near-term debt easily. That is good news, and I am not worried about PARA’s debt obligations. However, there is one other thing we have to consider - dividends.
Analysis of PARA’s Dividends
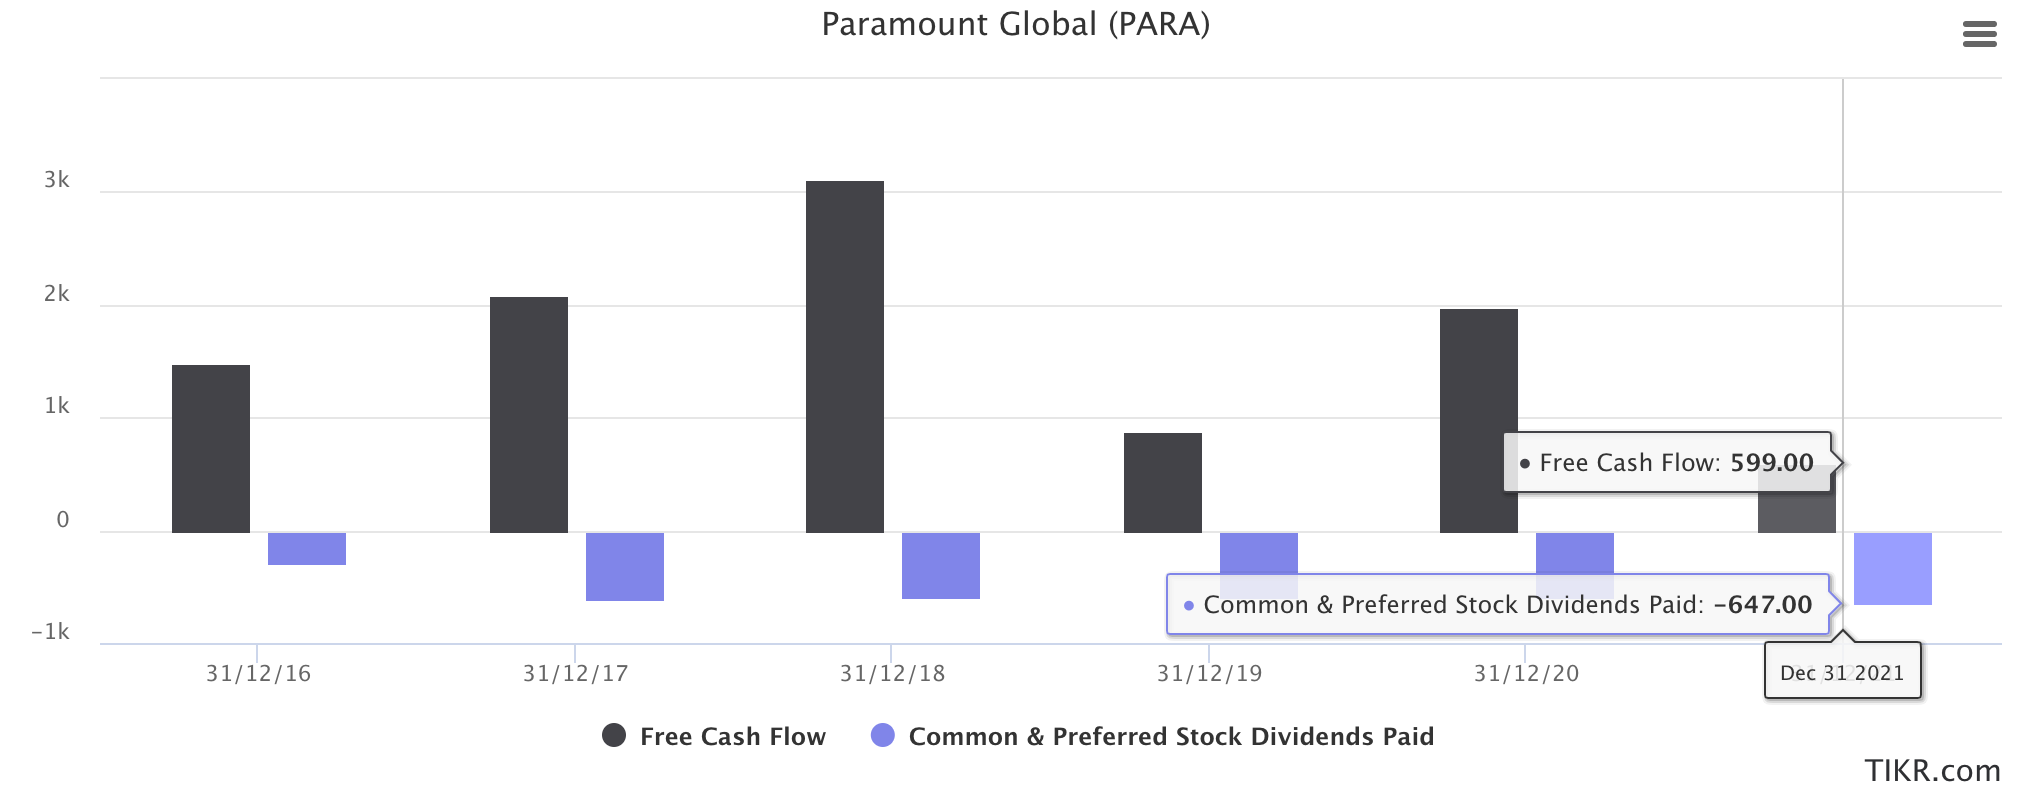
Having analysed NFLX, and WBD, and understood how competitive the streaming landscape is, it took me by surprise to learn that PARA is actually currently paying dividends. The company has a dividend yield of 5% on its shares. Given that the company has to use its FCF to pay off debt also, is the dividend even sustainable?
During the last fiscal year, the company generated only $599 million in free cash flow. That’s not nearly enough to even cover the company’s dividend payments of $647 million last year. Take a look at the chart below.
Going forward, we know management expects peak EBITDA loss in 2023, and thus we can expect lower FCF next year as well. Now let’s run a quick calculation to see how much dividends management can actually afford to pay in the next couple of years. From 2022-2025, PARA will earn a total FCF of $2.7 billion. If it pays off its debt in these years, it will be left with $1 billion. If we divide this by 4 years, it means that PARA will only be able to pay dividends of $250 million per year. That is less than half of its current dividend payout. This means that its current dividend is not sustainable!
If the dividend is reduced or even cut, we can expect to see selling pressure on the stock as legacy dividend investors leave. We already saw something similar with WBD as legacy dividend investors sold the stock after its spin-off from AT&T. I really do not like this. There is a high near-term risk of the dividend being reduced. However, I acknowledge that after PARA navigates the next couple of years, it will have the capability to pay handsome dividends going forward.
According to management, the company continues to pay a dividend because:
The dividend keeps many legacy dividend investors in the stock
They can’t institute a meaningful buyback with their current debt levels
They are focused on executing their DTC strategy.
None of the reasons really make sense to me, and I think that PARA will inevitably have to cut dividends. Do not get me wrong. I like PARA as there are many parallels with WBD. However, the fact that they are paying dividends, which is likely unsustainable, poses an additional risk that I have to account for in its valuation. With that, let’s wrap up the article!
Let’s Wrap Up!
As I mentioned at the start, here are the market perceptions of PARA.
After my analysis, here are my perceptions of PARA.
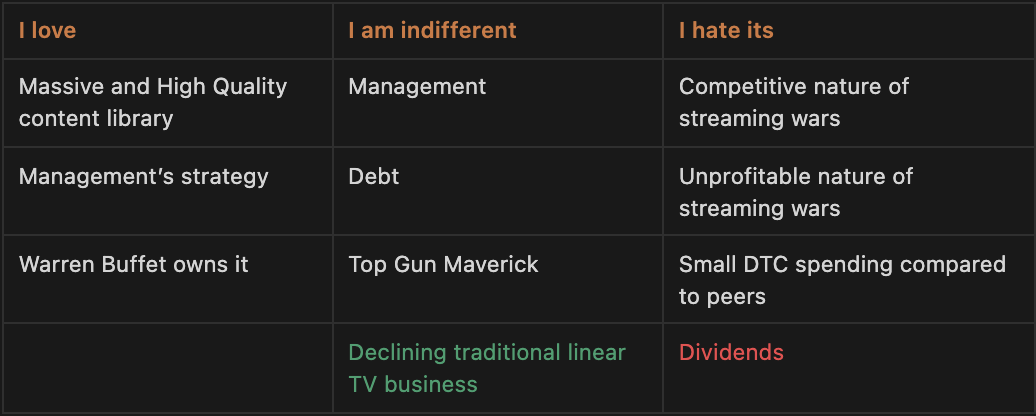
It seems that the market’s perception is slightly more optimistic than my own perception of the company. What do you guys think? Leave it in the comments below!
Up Next!
Has PARA’s current stock price accurately priced in its risk and reward? What are you waiting for? Read my second article!
Subscribe to not miss out on our next drop!!!
Disclaimer: The information contained herein is for informational purposes only. Nothing in this article should be taken as a solicitation to purchase or sell securities. Before buying or selling any stock, you should do your own due diligence or consult a financial advisor. Investing includes risks, including loss of principal.