Time to read: 15 min
First, I’d like to welcome new readers to The Retail Deep Dive. So glad to have you join us! Our mission is to analyze companies with exciting prospects and unpack them logically for our readers.
This month’s deep dive is on Disney (DIS), another media behemoth.
We decided to split our research into 2 separate articles to break it down nicely for you. The 1st article will focus on an analysis of DIS, while the 2nd article will evaluate DIS’s financials.
This is the second article.
Disclaimer: I own shares of WBD and PARA.
Breakdown
Creating my own estimates
Analysing analyst estimates
Relative Valuation
Conclusion
My Estimates
1. DTC segment
Before we project DTC revenues and operating income, let us understand how DIS defines subscribers and ARPU.
Definition of paid subscriber
Because DIS has many streaming platforms, its definition of subscribers is very complex. Below is how DIS identifies each of its subscribers. Feel free to skip ahead if you don’t want to trouble yourself with definitions.
Paid subscribers reflect subscribers for which we recognized subscription revenue. Subscribers cease to be paid subscribers as of their effective cancellation date or as a result of a failed payment method. Subscribers include those who receive a service through wholesale arrangements including those for which we receive a fee for the distribution of the service to each subscriber of an existing content distribution tier. When we aggregate the total number of paid subscribers across our DTC streaming services, we refer to them as paid subscriptions.
Total Disney+ subscribers are broken down into 3 categories Domestic, International excluding Hotstar, and Hotstar. The first 2 categories combined together represent Disney+ Core. Disney+ Hotstar launched on April 3, 2020 in India (as a conversion of the preexisting Hotstar service), on September 5, 2020 in Indonesia, on June 1, 2021 in Malaysia, and on June 30, 2021 in Thailand. Star+ launched in Latin America on August 31, 2021. International excluding Hotstar includes the Disney+ service outside the U.S. and Canada and the Star+ service in Latin America. Thus, in Latin America, if a subscriber has either the standalone Disney+ or Star+ service or subscribes to Combo+, the subscriber is counted as one Disney+ paid subscriber.
In the U.S., Disney+, ESPN+ and Hulu SVOD Only are each offered as a standalone service or as a package that includes all three services (the SVOD Bundle). Subscribers to the SVOD Bundle are counted as a paid subscriber for each service included in the SVOD Bundle.
Effective December 21, 2021, Hulu Live TV + SVOD includes Disney+ and ESPN+ (the new Hulu Live TV + SVOD offering), whereas previously, Hulu Live TV + SVOD was offered as a standalone service or with Disney+ and ESPN+ as optional additions (the old Hulu Live TV + SVOD offering). Effective March 15, 2022, Hulu SVOD Only is also offered with Disney+ as an optional add-on. Subscribers to the Hulu Live TV + SVOD offerings are counted as one paid subscriber for each of the Hulu Live TV + SVOD, Disney+ and ESPN+ offerings. A Hulu SVOD Only subscriber that adds Disney+ is counted as one paid subscriber for each of the Hulu SVOD Only and Disney+ offerings.
Definition of monthly ARPU
Below is how DIS defines its ARPU. Again, feel free to skip ahead if you don’t want to trouble yourself with the definitions.
Average monthly revenue per paid subscriber (AMRPU) is calculated based on the average of the monthly average paid subscribers for each month in the period. The monthly average paid subscribers is calculated as the sum of the beginning of the month and end of the month paid subscriber count, divided by two.
Revenue includes subscription fees, advertising (excluding revenue earned from selling advertising spots to other Company businesses) and premium and feature add-on revenue but excludes Premier Access and Pay-Per-View revenue. The average revenue per paid subscriber is net of discounts on offerings that carry more than one service. Revenue is allocated to each service based on the relative retail price of each service on a standalone basis. Revenue for the new Hulu Live TV + SVOD offering is allocated to the SVOD services based on the wholesale price of the SVOD Bundle.
In general, wholesale arrangements have a lower average monthly revenue per paid subscriber than subscribers that we acquire directly or through third-party platforms.
The Future
1. DIS+
DIS+ Core experienced a subscriber growth rate of 37% in 2022. Management expects to reach between 135 million to 165 million core Disney+ subscribers by the end of 2024 and that Disney+ as a service will achieve profitability in the same year. To be conservative, I will instead expect DIS+ frontload growth in the earlier years before tapering off, and to grow subscribers between 15% to 0% until 2027. (Refer to highlighted cells below)
DIS+ US will introduce an ad tier, Disney+ Basic, on 8 December 2022. When it arrives, it will cost $7.99 a month, the same price that the ad-free version of Disney+ costs now. DIS will raise the ad-free version from $7.99 a month to $10.99/month, a $3-a-month increase. DIS+ International will only get DIS+ Basic sometime in 2023. Therefore, I will project that DIS+ Core ARPU will grow moderately by 15% in 2023 and 10% in 2024, and remain flat thereafter. (Refer to highlighted cells below)
DIS+ Hotstar experienced a subscriber growth rate of 41% in 2022. Management expects to reach up to 80M subscribers by fiscal '24 as well. I expect DIS+ to grow subscribers between 15% to 0% until 2027.
(Refer to highlighted cells below)DIS+ Hotstar ARPU is extremely low, standing at $0.58 in 2022. Like Disney+ Core, I expect that management will increase its ARPU sometime in the future. Therefore, I will project that DIS+ Core ARPU will grow between 15% to 0% until 2027. (Refer to highlighted cells below)
There are currently almost 1.7B TV households in the world. Out of that, let’s assume 400M is in China. So that means the market opportunity today is almost 1.3B households. Let’s further assume that only 80% of these households actually regularly use their TV and will move to an OTT service. If this is the case, the opportunity now stands at 1B households. To be even more conservative, let’s further assume that people will only subscribe to 1 streaming platform. Given that there are 4 big players, NFLX, DIS, WBD, and PARA, this means that the maximum number of subscribers each streaming platform may have is 250M each (assuming average distribution). Since my estimates for Total Disney+ subscribers for 2027 are below 250M, my estimates should be conservative enough.
2. Hulu
Hulu SVOD experienced a subscriber growth rate of 20% in 2021 and 8% in 2022. Given the rise of other large streaming platforms and potential cannibalisation from DIS+, I will assume that Hulu will not grow in the next couple of years. Moreover, I will also assume that Hulu SVOD subscription prices remain flat. (Refer to highlighted cells below)
Hulu SVOD + Live TV experienced a subscriber growth rate of 0% in 2021 and 10% in 2022. Going forward, I will assume that Hulu SVOD + Live TV will not grow in the next couple of years. Again, I will also assume that Hulu SVOD + Live TV subscription prices remain flat. (Refer to highlighted cells below)
3. ESPN+
ESPN+ experienced a subscriber growth rate of 65% in 2021 and 43% in 2022. Going forward, I will assume it grows subscribers between 15% and 0% until 2027. I will also assume that ESPN+ ARPUs grow by 3% annually.
(Refer to highlighted cells below)
Projection
Based on my projections, DIS+ will have a DTC revenue of $29B in 2027 with an operating income close to $3B.
Now, let’s project revenues and operating income for the next business segment - Linear Networks.
2. Linear Networks
The Future:
The trend of cord-cutting will continue, causing Linear Networks’ revenue and operating income to decrease. Based on research by Statista, revenue is likely to decrease at a rate of 4% per year in the near future. It may be a possibility that there might come a point in time when operating margins become negative.
Projection:
Linear Networks made $28.3B in 2022. If this falls by 4% per year till 2027, it will mean that 2027 revenues will stand at $23B with an operating income of $5.8B.
Now, let’s project revenues and operating income for the next business segment - Content Sales & Licensing.
3. Content Sales & Licensing
The Future:
Content Sales & Licensing revenues are mostly made up of TV/SVOD distribution, Theatrical distribution, and Home entertainment distribution revenues.
According to management the results for 2021 are because:
TV/SVOD Distribution: Less content available to sell to 3P because of COVID-19 disruptions. Moreover, DIS shifted from licensing our content to third parties to distributing it on our DTC streaming services.
Theatrical Distribution: Theater closures and capacity restrictions in many territories.
Home entertainment distribution: 36% lower unit sales and 5% lower average net effective pricing.
According to management the results for 2022 are because:
TV/SVOD Distribution: Impact from the shift from licensing our content to third parties to distributing it on our DTC streaming services.
Theatrical Distribution: It mostly recovered, but is still experiencing slight COVID disruptions.
Home entertainment distribution: Lower unit sales despite the benefit of more new release titles in the current year. Net effective pricing was comparable to the prior year.
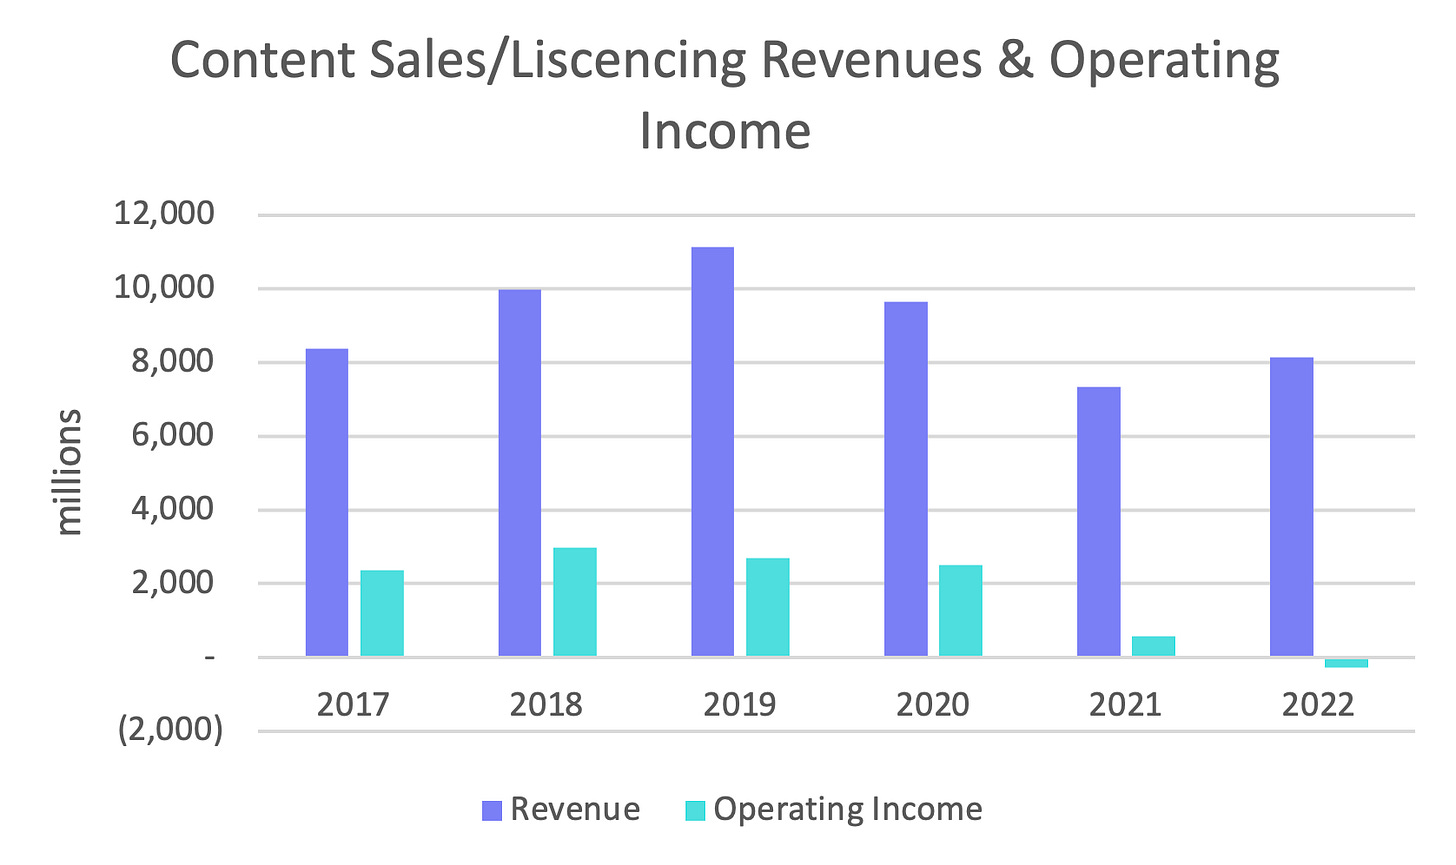
Therefore, while it seems that Theatrical Distribution is likely to make a complete recovery in the next couple of years, the change in TV/SVOD Distribution and Home Entertainment Distribution is more likely to be structural in nature. This makes sense. With Streaming on the rise, fewer people would be willing to rent DVD/s or digital movies. This suggests that the lower results we saw in 2021 and 2022 are not anomalies, but the new norm. That being said, WBD and PARA still have a profitable Licensing business, so I at least think DIS can have positive operating margins for this segment.
Projection:
Therefore, I believe that Content Sales/Licensing will maintain $7B in revenues and $0.7B in operating profits going forward.
Now, let’s project revenues and operating income for the next business segment - Parks, Experiences and Products.
4. Parks, Experiences and Products
The Future
Pre-pandemic revenues and operating profits had been growing consistently with profit margins consistently at or above 20%. In 2022, the Parks business recovered stronger than ever. This was fuelled because of pent-up demand and increasing prices on admission tickets. However, I think this is unsustainable and the demand for Parks to plateau over time.
Projection
I expect the PEP segment to maintain its current revenues at $27B and operating income at $6B for the next 5Y.
Overall Estimates
Based on the sum of my individual business segment estimates above, I get the following:
I project that 2027 revenue will stand at $86B, operating income at $14.7B, giving a cumulative net operating income margin of 17%.
Now that I have formed my own revenue and operating income estimates, it’s time to compare them with analyst estimates.
Analyst Estimates
1. Revenues
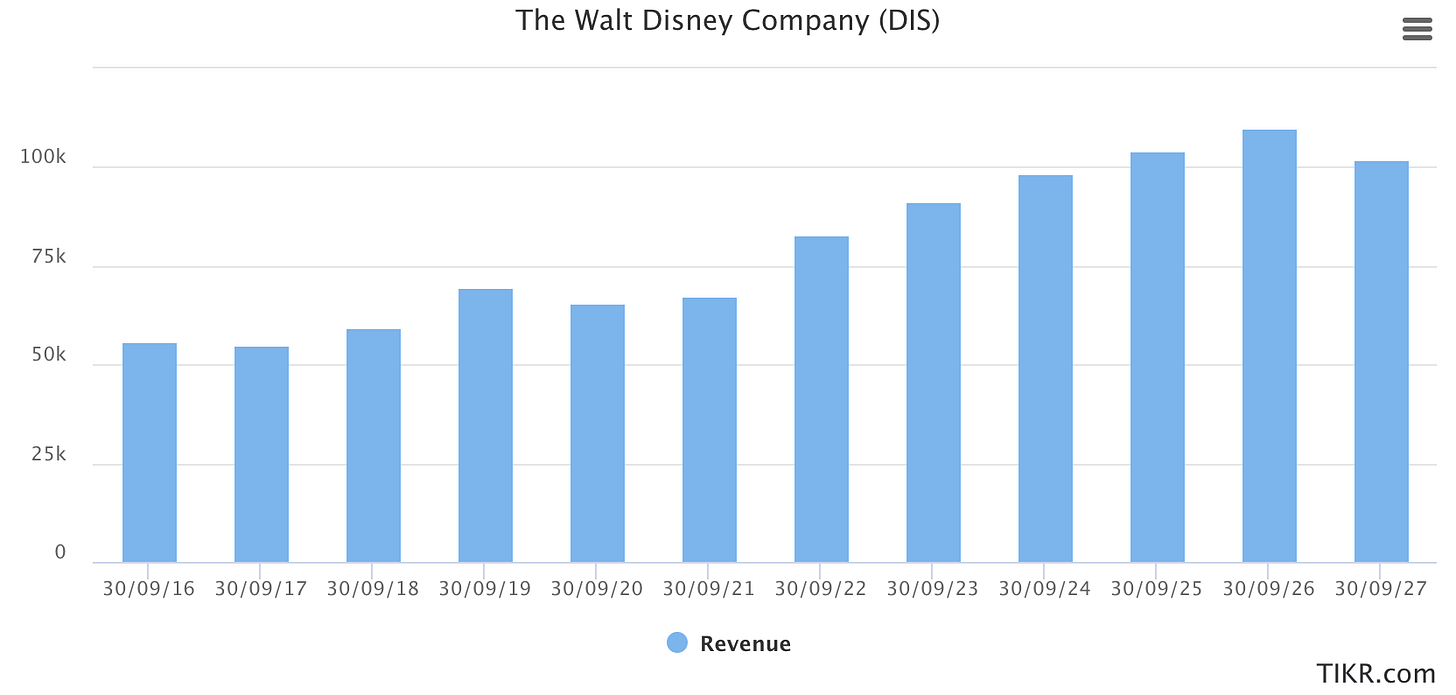
From 2017 to 2022, revenue has grown at a CAGR of 8.5%. From 2023 to 2027, analysts expect revenue to grow at a CAGR of 2.8% and reach $102B. This is 19% higher than my own revenue estimates of $86B in 2027.
2. EBIT
Note: EBIT reported is actual EBIT and not adjusted EBIT
From 2017 to 2022, EBIT shrunk. However, from 2023 to 2027, analysts expect EBIT to grow at a CAGR of 11% and reach $20.5 billion in 2027.
3. FCF
From 2017 to 2022, FCF shrunk. However, from 2023 to 2027, analysts expect FCF to grow at a CAGR of 31.8% and reach $16B in 2027.
FCF VS Stock-based compensation
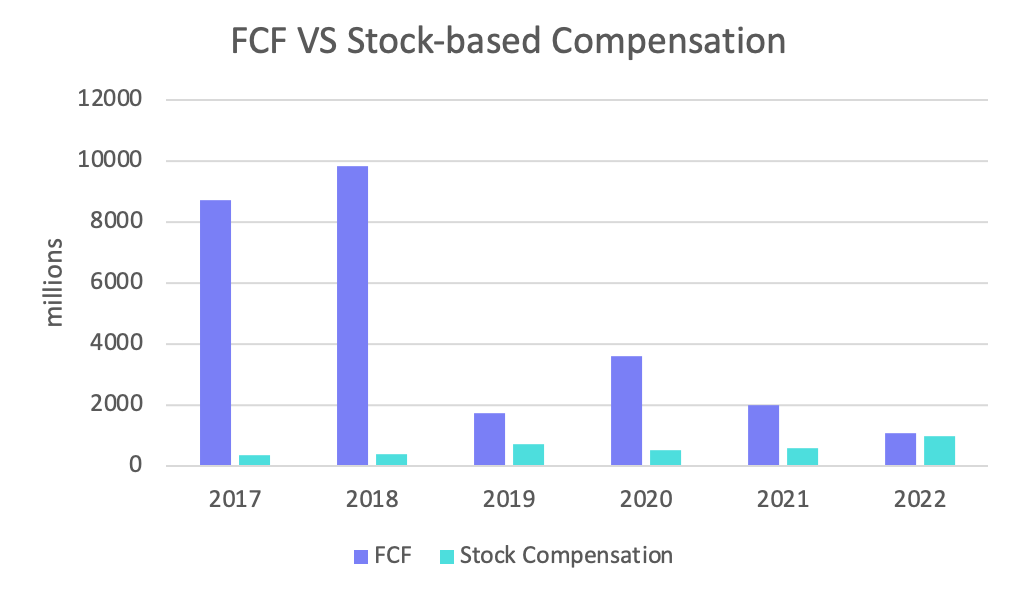
Stock-based compensation (SBC) does not impact FCF numbers since it is adjusted back in the CFO statement, however, it is a real expense so we have to account for it. It seems that DIS’s SBC has been increasing. In fact, if we account for SBC in 2022, investors would have no FCF attributable to them. Going forward, investors have to monitor whether FCF growth can outpace stock-based compensation growth.
4. Debt
DIS’s debt exploded in 2019 due to its acquisition of Twentieth Century Fox (TCF). The acquisition of $71B which was finalised in March 2019 was funded approximately 50:50 with cash and shares.
How much debt does DIS have today?
DIS has a total debt figure of $48B, which is the highest amongst its peers. In an increasing interest rate environment and an anticipated economic downturn, companies with high debt levels are more at risk of going bankrupt. As such, the market has punished the stock. But let’s dig more into it.
How much of its debt is due to mature soon?
According to its recent filing, 70% of the company’s debt has maturities after 2026. In comparison, 90% of PARA’s debt and 65% of WBD’s debt have maturities after 2026.
What is the interest rate on debt?
According to management, interest rates range from 1.75% to 9.5%. However, I am unable to draw the average cost of the company’s debt. Moreover, I cannot tell the percentage of fixed interest rate to the variable interest rate.
In comparison, WBD has an average cost of debt of 4.3%, with 87% of it having a fixed rate.
Will FCF be able to cover the near-term debt?
Remember that DIS has $48B in debt. If DIS were able to achieve a pre-pandemic FCF of around $7B, it would take the company 7Y to pay down its debt. In the worse case, if Streaming is proven to be less profitable than linear and hence less flowthrough to net income and hence FCF, DIS could take up to 8Y to pay down its debt. However, according to analyst expectations of future FCF, DIS will take only 5Y to pay down its debt.
Will DIS reinstate its dividends soon?
Before covid, DIS used to pay investors dividends. If DIS reinstates its dividend, we can expect many new dividend investors to establish positions. However, will DIS be able to reinstate the dividend anytime soon?
During the last fiscal year, the company generated only $1B in FCF. I will assume that DIS will reinstate its dividend only when its debt reaches its pre-covid maintenance levels of $15B. This means that before it reinstates its dividend, DIS will have to pay off $33B of debt first. If Streaming is more profitable than Linear, this may take up to 3-4Y. If Streaming is as profitable as Linear, this may take up to 5Y. If Streaming is less profitable than Linear this will take even up to 6Y.
I personally think that DIS will not reinstate its dividends anytime soon. Now, let us move on to our relative valuation of DIS.
EV/EBIT
I have decided to use EBIT over EBITDA as DIS’s Parks business has significant D&A unlike WBD and PARA, which need to be accounted for given the capital-intensive nature of PEP, and since its infrastructure is not going away anytime soon.
What do you get when you buy DIS?
A Linear TV business transforming itself to Streaming. However, you still don’t know if the streaming business is more or less profitable than linear tv.
The second largest streaming platform.
The largest and most popular IP library.
A profitable Parks & Experiences business (PEP).
A business with management issues.
What EV/EBIT multiple should DIS trade at?
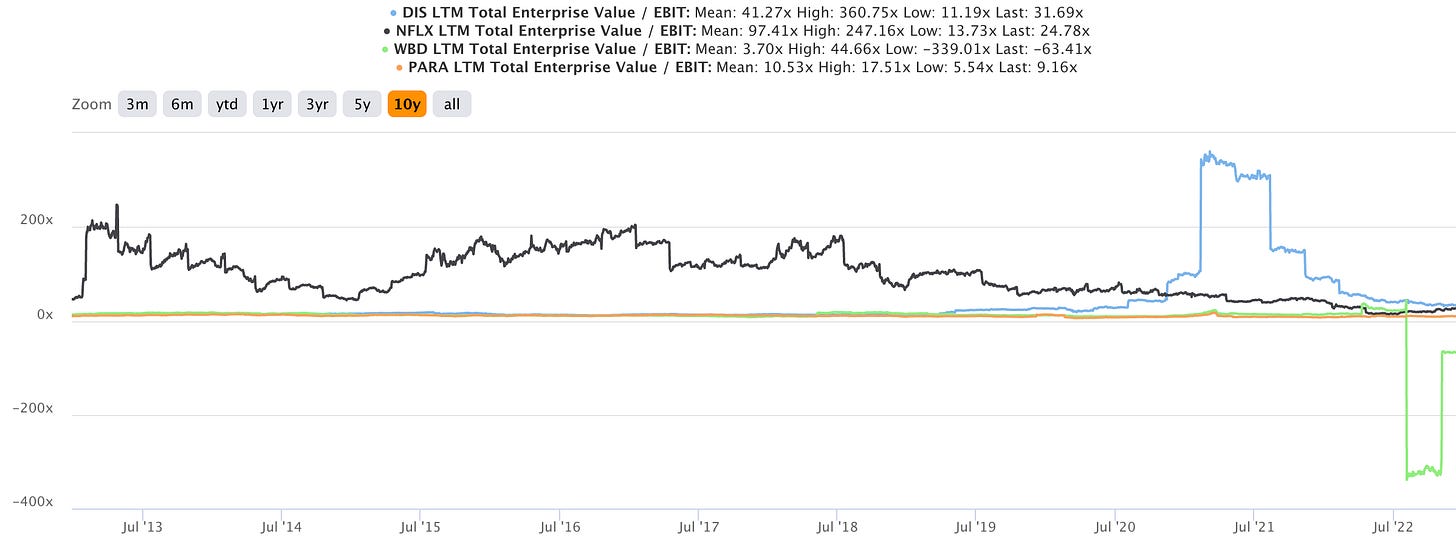
DIS is currently trading at an EV/EBIT multiple of 31.7x, compared to its 10-year historical multiple of 41.3x.
Comparing DIS to its historicals, DIS can trade a multiple of 25x.
Comparing DIS and NFLX up until 2027, DIS can trade a multiple of ~15x relative to NFLX.
Comparing DIS and PARA up until 2027, DIS should trade at a multiple of ~15x relative to PARA.
Comparing DIS and media conglomerates of the past.
If all Linear TV operations are ported over to Streaming, Streaming will become the new Linear TV. To determine what is an appropriate Linear TV company multiple we will use the 10-year average of the legacy media conglomerates. The multiples between the companies below differ because they each had different margins and were different in size.
DIS 10Y average historical multiple was 13.2x.
DISC 10Y average historical multiple was 12.7x.
PARA 10Y average historical multiple was 11.2x.
As I find it hard to distinguish the probabilities of each multiple derived above, I shall just take the average of ~18x as my Normal Case multiple for DIS in 2027.
So the three cases are:
Normal Case Multiple: 18X
The streaming business is equally as profitable as the linear business
Bear Case Multiple: 16X
The streaming business is less profitable than the linear business
Bull Case Multiple: 20X
The streaming business is more profitable than the linear business
Using analyst EBIT estimates:
Using the current stock price of $85 and analyst estimated 2027 EBIT of $20,469 million with scenario analysis, weighting 80% for the normal case and 10% for the other 2 cases, combined with a final 10% margin of safety, I get a TP of $178.30 for 2027, representing a 110% upside from today’s prices (16% CAGR). Not bad! However, instead of using the more optimistic analyst EBIT estimates, I will now use my more conservative EBIT estimates.
Using my EBIT estimates:
Using the current stock price of $85 and my own more conservative estimated 2027 EBITDA of $17,400 million with scenario analysis, weighting 80% for the normal case and 10% for the other 2 cases, combined with a final 10% margin of safety, I get a TP of $151.57 for 2027, representing a 78% upside from today’s prices (12% CAGR).
DIS’s returns are close to meeting my hurdle rate of 15%, thus I am considering initiating a position in the company when it reaches $80.
Please note that this is NOT my recommendation to buy/sell DIS, but just a disclosure on my own end. Always consider my research as my personal investing journal, and use it as a springboard for your own due diligence.
Upcoming catalysts
Disney is implementing ads into DIS+ in December. Given the positive reaction to NFLX ads, DIS could face a similar catalyst which may boost its stock price.
Risks
The recent change in CEO may lead to a different strategic direction for the company.
Streaming may be a lower-margin business than Linear.
Since a big part of Disney's business is driven by discretionary spending, any downturn in the economy will likely prolong the time required to transition to streaming.
Because of its sheer size, DIS may face a regulation risk
Vocal employees may cause internal disputes within the company.
Up Next!
I am considering analysing Adobe (ADBE) or Twilio (TWLO) next. As a subscriber, you can vote for the analysis you want! If you are not yet a subscriber, subscribe to unlock this privilege! It’s free now!
Portfolio Disclosure
Please note that my portfolio holdings are not a recommendation to buy/sell these securities. I make this disclosure solely so that you can assess potential biases that I have because I do have them. Always consider my articles as my personal investing journal and never forget that I do make mistakes. In fact, one of my objectives for this newsletter is to identify my mistakes and learn from them.
Disclaimer: The information contained herein is for informational purposes only. Nothing in this article should be taken as a solicitation to purchase or sell securities. Before buying or selling any stock, you should do your own due diligence or consult a financial advisor. Investing includes risks, including loss of principal.


Very nice write up. Clear and concise.